It my understanding that the running does increase bone density in the areas affected by running....but sweet fa for the upper body.
Triathlon Forum
Login required to started new threads
Login required to post replies
Re: Strength Training, Science vs N=1 [RebeccaCreekKid]
[ In reply to ]
Re: Strength Training, Science vs N=1 [Steve Irwin]
[ In reply to ]
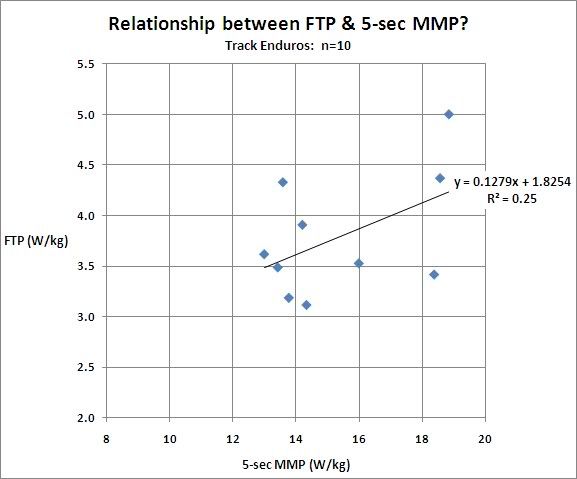
Well I ain't carving it up every which way to satisfy people's curiosity. But here's a subset of some targeting track endurance events (a range of abilities/categories here):
_________________________________________________________________________________
Training Plans -- Power Meter Hire -- SRM Sales Australia -- cyclecoach.com -- My Blog -- Sydney Turbo Studio
_________________________________________________________________________________
Training Plans -- Power Meter Hire -- SRM Sales Australia -- cyclecoach.com -- My Blog -- Sydney Turbo Studio
Re: Strength Training, Science vs N=1 [Alex Simmons]
[ In reply to ]
Clearly you aren't carving it up well enough. I see two distinct groups governed by x=14 and x=18.5. Oh, and it's quite obvious that there's one person in no man's land. I think if you draw a line from Mr. No Man to any of the other points you'll find the answer. It must be in there somewhere!!!
Re: Strength Training, Science vs N=1 [RebeccaCreekKid]
[ In reply to ]
Re: Strength Training, Science vs N=1 [Mike Prevost]
[ In reply to ]
Until I see a video of a PROPER squat executed by this guy (instead of a leg-press quarter squat) I'm not believing that claim.
Re: Strength Training, Science vs N=1 [Steve Irwin]
[ In reply to ]
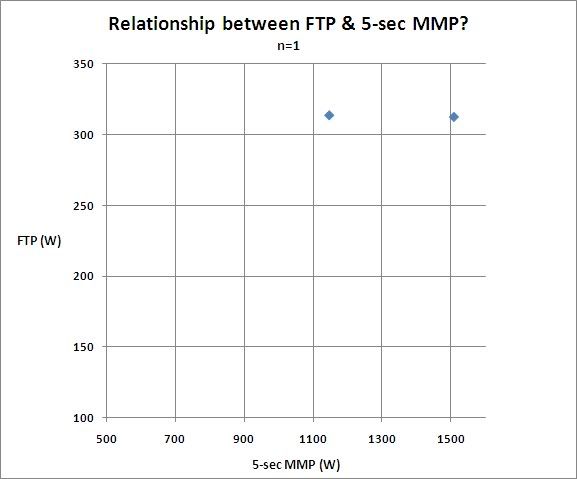
OK, one more subset, this time N=1, same rider different years. Data represent true best efforts.
_________________________________________________________________________________
Training Plans -- Power Meter Hire -- SRM Sales Australia -- cyclecoach.com -- My Blog -- Sydney Turbo Studio
_________________________________________________________________________________
Training Plans -- Power Meter Hire -- SRM Sales Australia -- cyclecoach.com -- My Blog -- Sydney Turbo Studio
Re: Strength Training, Science vs N=1 [Alex Simmons]
[ In reply to ]
And, your point? What is the story in the interim?
I get the impression you are trying to say the relationship is random. It is not. Even you, I think, will agree that the max power one can hold for x seconds is greater than the max power they can hold for x+1 seconds. The slope of the curve is always negative and that the drop is greater when x is small than when x is large. And, at any point in time, the curve is always the same for the same person, although with training it can change, as you have demonstrated. It would seem to me that the training history of the person, combined with his/her make-up would determine that curve. It would appear that the above example concentrated his training on shorter efforts compared to 6 hour efforts.
You can't make any sense out of the data either because you don't have enough data (only two points of a curve or don't have their fiber type make up or something else) or not looking at it properly (not separating them into their proper groups, whatever they might be).
--------------
Frank,
An original Ironman and the Inventor of PowerCranks
Re: Strength Training, Science vs N=1 [Frank Day]
[ In reply to ]
Might I suggest one other way of looking at this data visually. Your method, I believe, magnifies the differences. How about graphing the points vs time. So, each person would have two points, one at 5 seconds and one at 3600 seconds. Then draw a line between the two. I think you would find that the slopes of the various lines, while having some differences, would be quite similar.
The question that is unanswered, it seems, is how to fully explain the differences?
--------------
Frank,
An original Ironman and the Inventor of PowerCranks
The question that is unanswered, it seems, is how to fully explain the differences?
--------------
Frank,
An original Ironman and the Inventor of PowerCranks
Re: Strength Training, Science vs N=1 [Alex Simmons]
[ In reply to ]
First of all, Alex, thank you for taking the time to analyse and share the data that you have.
I'm wary of seeing what I want to see in the first graph. I can see different ways to analyse it that would lead to drastically different conclusions. On the most basic level, it shows a weak correlation between 5 second and 60 minute power (and I'm not expecting any more than a weak correlation at best), but the data is quite sensitive to the sample in that if we experimented with removing one person from the sample, it would change things quite a bit depending on which person we removed.
Regarding the second graph, I have no problem at all believing that someone can increase their 5 second power without increasing their FTP. Indeed it would be easy to increase your 5 second power while decreasing your FTP if you changed your training emphasis. My speculation has always been that 5 second power might indicate a potential limiter to achievable FTP, not that everyone with a particular 5 second power will train in a way that reaches their maximum potential FTP.
I'll give a couple of examples of what I am talking about from swimming. David Davies won silver in the 2008 Olympics in the 10km open water swimming race. This makes him a mega-endurance athlete in swimming terms, as that race lasts almost 2 hours compared to less than 15 minutes for the longest pool race. However David Davies has raced LC 50m freestyle in 24.70 seconds. Only 298 people in GB have swum a faster 50m freestyle than that in the last decade, i.e. his 50m speed is very fast indeed compared to most competitive swimmers. Now, I'm sure that if he shifted his training focus, he could swim a faster 50m, and at the same time his 1500m+ times would get slower. And it is also the case that none of the 298 people who are faster than him at 50m have swum faster 1500m+ races than him. But his 50m speed is a pre-requisite for his 1500m+ speed. I can absolutely guarantee that nobody who can only do LC 50m in 27 seconds, say, will ever match David Davies' 1500m+ times. Another example is Russian Yuri Prilukov, roughly similar speed to David Davies over 1500m. I can't find a 50m time for Yuri, but he has done LC 100m in 51.54. Only 69 British swimmers have swum faster than that in the last decade. Again, that kind of 100m speed is a pre-requisite to being able to swim a fast 1500m. Not everyone who can swim 100m at that speed can swim a fast 1500m, but if you want to swim a fast 1500m, you're going to need to be able to swim 100m at that kind of speed.
So in terms of 5 second power and FTP, what I'm thinking about is suppose we have a rider who has already trained to optimise their FTP, and their FTP has been static for several years, they just aren't managing to improve any further. They probably have a lot of capacity to increase their 5 second power with specific training, so lets suppose they spend a period of time increasing their 5 second power by 10%. Then they shift the emphasis back to FTP training. It will take quite some time for that 10% improvement in 5 second power to be lost, and the question is might they then be able to get their FTP 1% higher than it was before, now that they are building from a higher raw power starting point?
Re: Strength Training, Science vs N=1 [Steve Irwin]
[ In reply to ]
I think the diff here is that in cycling there is almost not technique involved to increase 5 second power....just pound harder. Part of the reason why you need a fast 50m free to swim a fast 1500m free is because the sport is so technical. Its almost like the physiological adaptations at the various training intensities are meaningless int the void of good technique at high speed.
Re: Strength Training, Science vs N=1 [Steve Irwin]
[ In reply to ]
If you ask anyone who's seen a lot of power data from different riders, I think they'll all agree that there's no correlation. None. Many untrained individuals will have higher 5 second power than elite riders.
You can give them, but it's a poor comparison, for 2 reasons: 1)swimming is a highly technical sport, so the technique advantages will carry over regardless of distance (that's not the case in cycling) and 2) even the shortest swimming event is fueled by a different energy system than 5 second power.
Re: Strength Training, Science vs N=1 [devashish_paul]
[ In reply to ]
While it is true that for many there may be no technique involved in increasing cycling power I am surprised that you, a PowerCanker, would imply that it is never involved. Cycling improvements, just ans swimming or running or lifting or anything else improvement, may or may not involve technique improvements.
--------------
Frank,
An original Ironman and the Inventor of PowerCranks
--------------
Frank,
An original Ironman and the Inventor of PowerCranks
Re: Strength Training, Science vs N=1 [roady]
[ In reply to ]
well, if you assume it is a straight line correlation I would agree that there is no correlation. But, if you had three points, I think you would find there is a great deal of correlation and that you would be able to predict that athletes performance anywhere on the curve. Three points gives you the rate of drop off and then if you know the 5 sec data. Do 5 sec, 1 min, and 10 minutes and I'll bet you could predict the FTP within 2%.
--------------
Frank,
An original Ironman and the Inventor of PowerCranks
--------------
Frank,
An original Ironman and the Inventor of PowerCranks
Re: Strength Training, Science vs N=1 [roady]
[ In reply to ]
I think it must be 2) that is the crucial one because David Davies' 50m time would be world class if he were female, particularly as he did it before the shiny suits era. It seems unlikely that women have worse swimming technique than men, so I can only conclude he has a higher power output over 50m than almost all women.
Re: Strength Training, Science vs N=1 [Frank Day]
[ In reply to ]
Well, you'd be wrong--but that's nothing unusual.
You aren't very familiar with the Monod model, are you? I'd suggest plugging in some values for 1 and 10 minutes (which, BTW, are too short to really estimate FTP), then manipulate the 5 second power and see the MASSIVE impact 5 second power would have on predicted power output (at most, around 1%). Here's a calculator to make it easy: http://teamhealthfx.com/...neral/entry1758.aspx
Just for laughs I entered values for 5 riders using your parameters. The results ranged from 5-12% off.
Re: Strength Training, Science vs N=1 [roady]
[ In reply to ]
Huh? What parameters are "mine"? I think the curves would have to come from actual data from the athletes and not "plugging" in some values to see what you get. The spreadsheet you linked is exactly what I am talking about. The curve would be specific to each person, depending upon what their muscle make-up is and what type of training they have done. Unfortunately, it would seem that the spreadsheet falls apart for any data less than 3 minutes so it cannot be used for this data but the power/duration curve that spreadsheet gives is exactly what I was talking about and if you will notice it takes 3 data points to calculate it (and we only have two data points for these athletes). There is a curve that will define how each individuals performance drops off. Three points along that curve should be pretty good at determining the curve unless there are any step changes in the curve that might occur, say, when the predominant energy systems shift with different durations. Perhaps that happens at durations less than 1 minute or so making the 5 second data useless in this determination. Since the curve cannot continue to increase exponentially as one gets to zero seconds there must be a second curve leveling the increase off (but 1 second is still going to be larger than 5 seconds). For my "three point curve" to work the first point would have to be outside of that point or we would have to know how and where that leveling occurs. Where is that? 5 seconds, 10 seconds, 30 seconds, 1 minute? I don't know, do you?
Except for athletes like weight lifters 5 second power is probably irrelevant. Even track sprinter efforts last longer than that.
--------------
Frank,
An original Ironman and the Inventor of PowerCranks
Except for athletes like weight lifters 5 second power is probably irrelevant. Even track sprinter efforts last longer than that.
--------------
Frank,
An original Ironman and the Inventor of PowerCranks
Re: Strength Training, Science vs N=1 [Frank Day]
[ In reply to ]
5 seconds, 1 minute and 10 minutes. I don't know of anyone else who thinks those are reasonable parameters to determine threshold power using the Monod model, since they're basically measures of neuromuscular power and/or heavily influenced by anaerobic capacity.
I did that, too--and came up with huge errors, as it relates to threshold power. The time parameters are too short.
As I said, plug in some numbers and see how little 5 second power changes the curve....
well, ignoring neuromuscular power is a good start. The default points on the chart of 3, 12 and 20 minutes seem pretty reasonable to me, and give an accuracy around 3% for a quick n=5.
Re: Strength Training, Science vs N=1 [Frank Day]
[ In reply to ]
I would like to make one more comment on the critical power spreadsheet you linked to. While that is close to what I was talking about it is not exactly what I was talking about. That spreadsheet seemingly has a one size fits all algorithm (presumably based upon data taken from a sample of athletes without regard to muscle type or training background) and when you plug in your data it seemingly comes up with the "best fit" for their algorhythm to your actual data. I am sure it is pretty good for most people. But, what I was talking about was taking the actual data for any individual and determining the equation that fits those three points (or, if you had 4 points the best curve to fit those points, the more points the better). You still need some sort of algorithm to determine the basic curve shape, parabola vs circle, but I think the basic curve shape is the same for all. If the data is good then I think that the resulting curve would be a better predictor than a one-size fits all algorithm even though that is a good estimate for most. If you know the general shape of the curve for any one individual then any one point on the curve determines all other points on the curve and the 5 sec or 10 second or 1 minute data is relevant. That work will probably never be done but that is what I was talking about.
--------------
Frank,
An original Ironman and the Inventor of PowerCranks
--------------
Frank,
An original Ironman and the Inventor of PowerCranks
Re: Strength Training, Science vs N=1 [roady]
[ In reply to ]
Ugh, I didn't specify they were good for the Monod model. I simply said a curve had to exist for each person. If good numbers put in any model do not predict outcome then the problem is with the model, not the numbers. The Monod model may be a great model for most applications (just like Newton's physics work for most applications) but it clearly does not work for all applications, like for 5 second power as an input. So, I would agree with your assessment that the Monod model does not work well using a 5 second power input. That is not particularly good evidence that 5 second power could not be useful using another model, yet to be developed.
--------------
Frank,
An original Ironman and the Inventor of PowerCranks
--------------
Frank,
An original Ironman and the Inventor of PowerCranks
Re: Strength Training, Science vs N=1 [Fooshee]
[ In reply to ]
Because the fraction of your maximal power that you can sustain for any duration is dependent upon other factors (esp. energy provision).
Re: Strength Training, Science vs N=1 [Frank Day]
[ In reply to ]
I suspect that those are Alex's personal data...in which case the story is both compelling and inspiring.
Re: Strength Training, Science vs N=1 [Steve Irwin]
[ In reply to ]
No. 27% of the variance in common - and as Alex's subsequent plot shows, that is due to the confounding influence of body mass.
Re: Strength Training, Science vs N=1 [Andrew Coggan]
[ In reply to ]
I believe my definition was correct. You take the fitted linear equation which relates the two quantities, and the fraction given by the Coefficient of Determination is referred to as the explained variance, and the remainder is the unexplained variance. In saying this we are not saying that "explained by" is the same thing as "caused by", we're just saying that mathematically the two sets of numbers are linked in that way.
While technically speaking, body mass is a confounding factor, would you take the same approach to dismissing the link between 59 minute power and 60 minute power? One doesn't directly cause the other, they are correlated because they share common causal factors such as increased plasma volume, increased muscle mitochondrial enzymes, increased heart stroke volume etc. The same effect is what is being speculated about for 5 second power vs 60 minute power, that training might bring about adaptations that affect both (and one such adaptation might be increased muscle mass).
While technically speaking, body mass is a confounding factor, would you take the same approach to dismissing the link between 59 minute power and 60 minute power? One doesn't directly cause the other, they are correlated because they share common causal factors such as increased plasma volume, increased muscle mitochondrial enzymes, increased heart stroke volume etc. The same effect is what is being speculated about for 5 second power vs 60 minute power, that training might bring about adaptations that affect both (and one such adaptation might be increased muscle mass).
Re: Strength Training, Science vs N=1 [Steve Irwin]
[ In reply to ]
By saying "change in" you implied that the data weren't cross-sectional in nature.
I would take the same approach in expressing the link between 59 and 60 min power. That is, if all I had were cross-sectional data, I would attempt to control for confounding variables such as body mass (although partial correlation would actually be a better method than a per ratio standard).
Last edited by:
Andrew Coggan: Jan 18, 10 13:47
Are you saying the data is cross-sectional? I don't think there is any data here to say that. We have no idea how this data was collected. We certainly know that the one data set, comparing the change in one person over time was not cross sectional.
http://en.wikipedia.org/...Cross-sectional_data
--------------
Frank,
An original Ironman and the Inventor of PowerCranks
http://en.wikipedia.org/...Cross-sectional_data
--------------
Frank,
An original Ironman and the Inventor of PowerCranks