The goal of this thread is not to see how has the most power, nor the biggest penis. It is to assess efficiency: i.e., to see who has the most efficient penis.
Please include the following information
NOTE: Please include data only from TT's where the start elevation was similar to the finish. No hill climbs, or downhill races!
1) Average watts
2) Average speed in MPH
3) Distance
4) Rider weight
5) Describe bike and wheels
6) Misc notes, to whine and make excuses for your lack of power and/or lack of aero
7) Optional: a picture (or link to a picture) of you in your aero position.
I'll go first:
1) 249 watts
2) 21.0 mph
3) 16 miles
4) 170 lbs
5) Cervelo P2C, Hed Jet 90 front, Wheelbuilder disk cover rear
6) This is actually a pretty bad data point because the course was very hilly, always going either up or down, sometimes at 8%, and it was raining. And my legs were shot from the week before.
--------------------------------------------------------------------------------------------------
RESULTS!
Here's a scatter plot of the data in this thread. I will update the google doc periodically and this will auto update
Raw Data and Interactive plot
Excel screen shot that's not updated as often (because uploading pics here is a pain)

----------------------------
UPDATE: AHare created more up to date graphs as of 8/12/2012 in this thread.
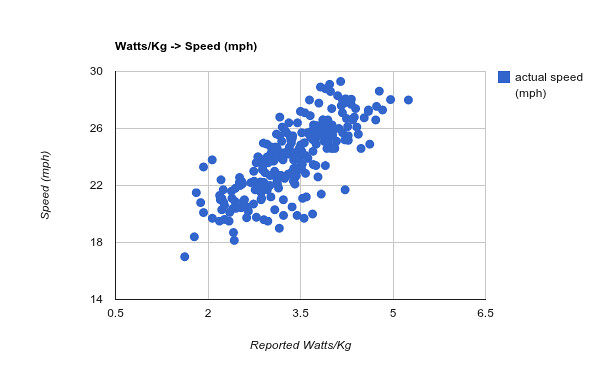
Here's a chart mapping from watts/kg to speed in mph. Big thing to note is just how fast it is possible to go on 4W/kg, with the right equipment and setup.
Here's one going from raw watts to speed, which is more spread out, since tiny, skinny people can go really fast on relatively fewer watts, and bigger, barndoorish people like myself can put out a ton of watts but still not go fast:

Raw data is here, along with the more-interactive chart data:
https://docs.google.com/spreadsheet/ccc?key=0Ap-T5i2jNxCQdFB3djB2Tl9zWEdCN0p4VkxZdXJrTHc
Please include the following information
NOTE: Please include data only from TT's where the start elevation was similar to the finish. No hill climbs, or downhill races!
1) Average watts
2) Average speed in MPH
3) Distance
4) Rider weight
5) Describe bike and wheels
6) Misc notes, to whine and make excuses for your lack of power and/or lack of aero
7) Optional: a picture (or link to a picture) of you in your aero position.
I'll go first:
1) 249 watts
2) 21.0 mph
3) 16 miles
4) 170 lbs
5) Cervelo P2C, Hed Jet 90 front, Wheelbuilder disk cover rear
6) This is actually a pretty bad data point because the course was very hilly, always going either up or down, sometimes at 8%, and it was raining. And my legs were shot from the week before.
--------------------------------------------------------------------------------------------------
RESULTS!
Here's a scatter plot of the data in this thread. I will update the google doc periodically and this will auto update
Raw Data and Interactive plot
Excel screen shot that's not updated as often (because uploading pics here is a pain)
----------------------------
UPDATE: AHare created more up to date graphs as of 8/12/2012 in this thread.
AHare wrote:
I collected all the data from the "post your watts and speed from your last race" thread and made a new chart, since the last one was last updated on like page 3 of the thread. Here's a chart mapping from watts/kg to speed in mph. Big thing to note is just how fast it is possible to go on 4W/kg, with the right equipment and setup.
Here's one going from raw watts to speed, which is more spread out, since tiny, skinny people can go really fast on relatively fewer watts, and bigger, barndoorish people like myself can put out a ton of watts but still not go fast:
Raw data is here, along with the more-interactive chart data:
https://docs.google.com/spreadsheet/ccc?key=0Ap-T5i2jNxCQdFB3djB2Tl9zWEdCN0p4VkxZdXJrTHc