Hi all,
Long time lurker, first post.
It’s a long one so tl;dr right here and skip to the end for the example:
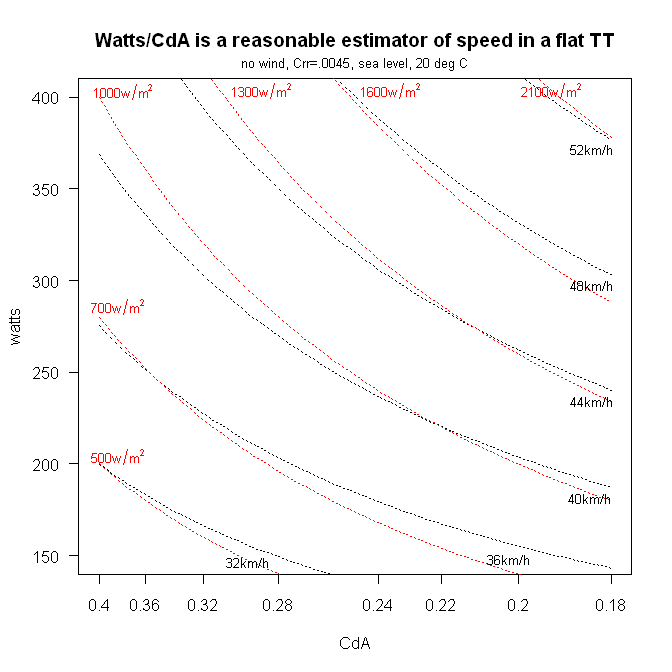
I’m coming to see if an Andrew Coggan-style (Watts / CdA) chart exists like the classic (W / kg) chart?** **
====== Context ======
My goal is to understand what other are accomplishing by looking at the statistical spread. Part of my selfish reasoning is I’d like to see where I stand. I understand I shouldn’t compare myself with others, but it’s a source of aspiration and motivation for me when I see what the hardworking and gifted ones are accomplishing. Seeing the upper bounds helps with this.
But right now, I don’t know what the “spread” looks like in regards to WCda, let alone CdA. So I took a stab at making my own which I’ve attached at the bottom, but I don’t want to reinvent the wheel.
The background is I’ve recently begun measuring CdA and cross-checking them with arm-chair calculators. The approaches:
RChung Method using halfpipes + GC AerolabsmyWindSock Premiumhttps://www.gribble.org/cycling/power_v_speed.htmlWundergroundhttps://www.gribble.org/cycling/air_density.htmlStrava RidesBicycleRollingResistance
Using these tools, my cross-checking methodology is loosely:
A. Measure “Real World” CdA average
- Go on solo “real-world” rides recorded by Strava. Focus on holding aero position.
- Use myWindSock to assess quick & dirty CdA
- Target key laps on Strava/myWindSock, and use Gribble calculators to crosscheck estimated CdA
- Use WUnderground, Gribble Air Density Calc, and BRR to crosscheck Rho and Crr
B. Measure Focused RChung CdA (Baseline Control)
- Crosscheck above with Aerolabs RChung Method, on a halfpipe
- Again using calculators to crosscheck Rho, Crr
Result: The RChung CdA sits in the middle of the Real World CdA, with the RW CdA having a larger spread, which is what I expect. The myWindSock data’s accuracy varies based on the windiness and road conditions of the day. A certain level of inaccuracy is also expected given that myWindSock is making larger leaps based on just a few estimated variables.
Because I just started last week, I’m using GPS instead of a speed sensor. Secondly, I’m still honing my RChung technique. My speed sensor is arriving in 2 days. I’d like to share deeper data once I get the speed sensor AND once my technique improve over the next few weeks. But today, I have prelim numbers to work with:
Rchung Measured: 0.2765 CdA
**Gribble Calculator: **0.2750 CdA
myWindSock Full Ride Avg: 0.261 CdA
Course & Ride:
- 28.73 miles / 436ft elevalation (pancake flat, large square loop, country roads)
- 23.0mph
- 229 W avg / 241w (NP)
- 1.187 kgm^3 Rho
Bike Equipment:
- Allez Road Bike (7.6kg)
- 25mm Turbo Tires 80/80psi (0.00489Crr *1.13 = 0.0055)
- guesstimate to correct for rough country roads
- Drivetrain loss 3% (dirty chain, can’t clean right now)
Rider Equipment:
- Tight fitting jersey + bib
- Kask Mojito Helmet
- No gloves
- Arm warmers
- Long socks
- Fizik Tempo R5 Boa shoes
Rider & Position
- 5’6, 143lbs (64.86kg)
- Total system weight accounting for water/food/tools: 75.06kg
- Elbows in 90° Bend: Grip on Shifter Hoods
====== EXAMPLE ======
Here’s my stab to demonstrate what I’m looking for. Watts on the Y, CdA on the X… I got the “spreads” and “categories” researching a ton of website, but as you know none of the data is normalized, cleaned, or polished in anyway so these are ball parked figures. One example: https://gccoaching.fit/...flat-roads-wattscda/
Again, my goal’s to see if CdA statistical data exists for different riding positions so that I can label categories and spreads. If I used my own data, I can see that my CdA still has lots of sheds to get to that lower bound of 0.24 CdA for road. And plenty more if I jump on a TT bike.
I did another version that takes the cubed root of the Watts/CdA. Just to get the final number down to single/double-digits.