What qualifies as “Drastic” in Windy world? S&P down almost 3% today. Almost 10% in the last 3 weeks.
1 Like
And Lia Thomas’.
Another 10 - 15% would be cool.
1 Like
I’d consider loading up down another 15%
Same here.
Can’t try to time the floor, exactly right. I cut my MF holdings end of summer by 2/3 and went all bond/CD with that. They’re maturing and I’m buying. Yep, last weeks buys are already down. Don’t care. By the time i get this all reinvested I’ll be buying on the way back up.
Banks Cite ‘Extreme U.S. Policies’ for Weaker Forecasts
Economists at JPMorgan Chase said that the risk of a recession had edged up to 40% from 30% owing to “extreme U.S. policies,” the Wall Street Journal reports.
Goldman Sachs, which has consistently anticipated above-consensus growth in recent years, now says it expects weaker growth than the rest of Wall Street.
Meanwhile, former Treasury Secretary Larry Summers, the inflation canary in the coal mine under President Joe Biden, puts the chances of recession at “getting close to 50/50.”
Nothing drastic.
Off to another rough start today, djia currently down another 462
If the end game is a recession… he’s doing a great job.
Everything is now up sharply in the last half hour. What now?
The problem is the tariffs just aren’t high enough. If we double all of them we should be good. (I probably just put as much thought into my economic plan as Trump did with his)
1 Like
Tariffs are a tax hike on foreign countries that have been ripping us off. Tariffs are a tax cut for the American people…
And I think it’s insulting you’re trying to test my knowledge of economics and the decisions this president has made.
Whoboy, always playing the victim…
Painfully stupid liar.
Famous Nobel economist Tommy Tuberville explains how this is all part of the plan.
“And people are looking at the stock market like, ‘Hey, this is like the highest it’s gonna continue for months and months and months.’ That’s not gonna happen. We were probably over-bloated with the stock market here for a while,” Tuberville told Larry Kudlow.
1 Like
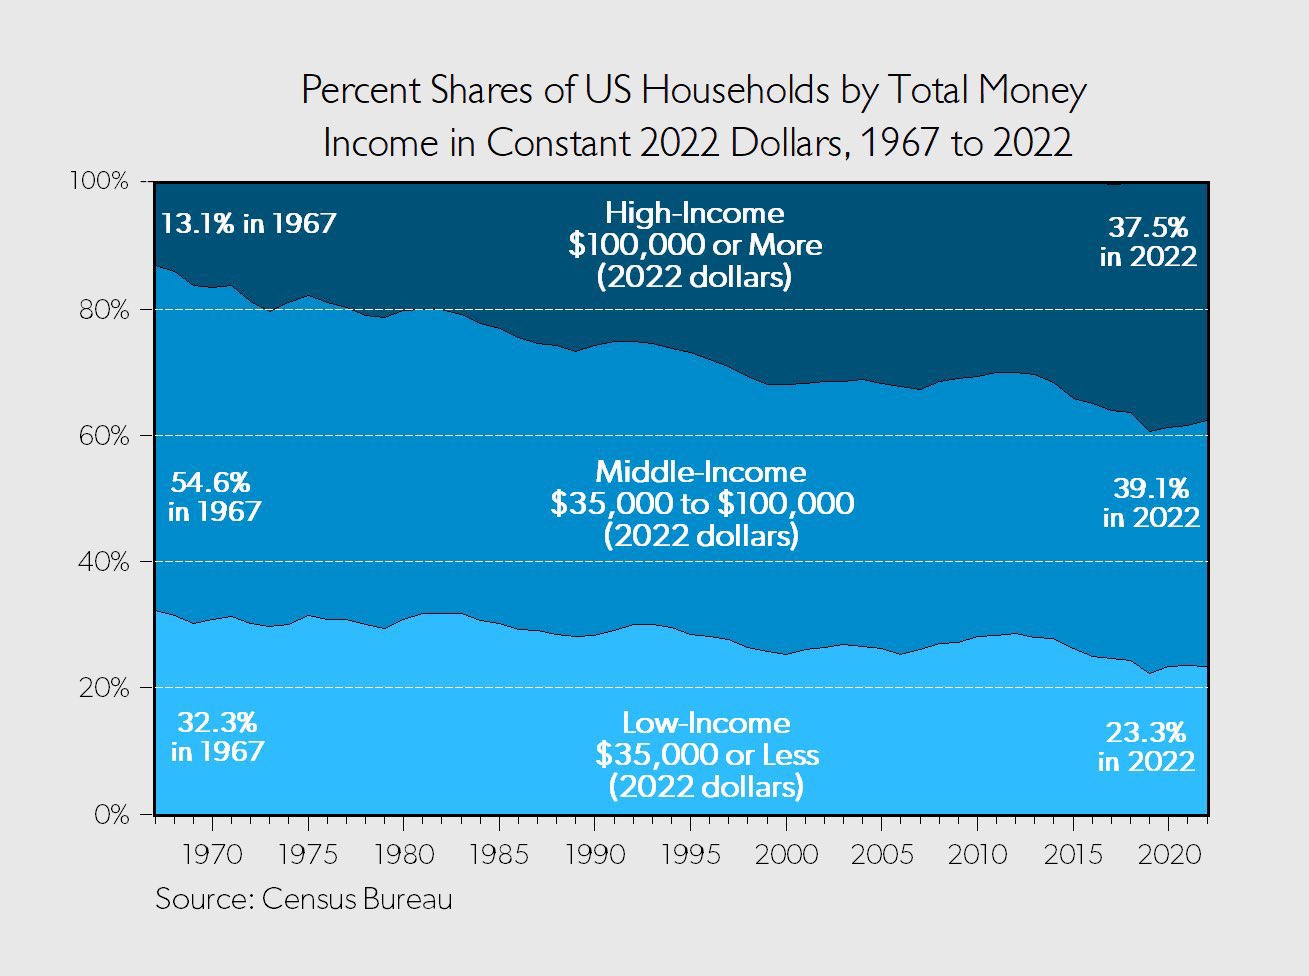
You need to adjust the chart for purchasing power
Isn’t that what the chart does by adjusting all dollars to 2022 values? (I can easily be wrong here: I would never claim to be a financial expert.)
- Jeff
1 Like
Basically, you’re right. By using constant 2022 dollars, the chart adjusts for inflation.
That said, depending on the point someone is trying to make (or study), they might need to slice things more finely. For example, rich(er) people buy a somewhat different mix of things than poor(er) people and thus can experience inflation in different ways.
Also, for what it’s worth, that is a chart of household income, not individual income. Households have changed over the years since 1967: they are more likely to have two wage earners and they have fewer kids.
I thought the same thing at first Ike so I hit the Google machine. I was surprised to see that in 1967 44 %of married-couple families had both the wife and the husband working. It 2022 it was only marginally higher, 48.9%.
Perhaps it might be related to women earning more today?