OK I’m sure this has been asked before, but I was unable to search it out. I’d like to know what apples to apples efforts would be comparing swimming to running.
For example. Mile world record of 3:43 is equal to the swim world record of approx 15:00 (converted 1500 time).
So what swim times would be equal to the following running times in a mile?
The best way to convert would be if running had a numeric points system. If it does, you could probably compare it to the FINA points system, which you can find a calculator for here: http://www.swimdb.ca/time_stds/
The other way to compare it would be to look at what a given time gets you. A 15:43 gets you into the top-8 at Canadian world championships trials. 3:51 for a 1500m gets you into the top-8 at the canadian track and field championships. It gets much harder as the times get slower though.
A more accurate comparison would probably be running a mile to swimming a 500. In that case, probably the same times plus a few seconds (i.e., roughly 5:10, 6:12, 7:15, 8:20 give or take).
You could take qualifying times for events (state track meets, state swim meets, college, professional, etc…) or averages of winning times at meets and go from there. Personally, I would add more like 20 seconds to the run time based on that information.
I made it more scientific: AR mile = ~3:47, AR 500 = ~4:08. That means running a 5:00 mile = swimming 5:28 500 free. Then 6:33, 7:39, 8:44 500 free times.
I wonder if you could use short tris to try to figure out comparable times.
100th swim time at a sprint tri: 1:58/100m
100th run time: 4:37/km (7:25/mi)
To validate, we can see if this technique matches other times posted so far.
gatorFL said 6:00 mile (3:43/km) → 6:33 500yd (1:25/100m)
and 7:00/mi (4:21/km) → 7:39/500yd (1:40/100m)
At the tri I used, 1:25/100m was 5th-fastest at swimming, and “converts” to a 3:46/km, which nearly matches GatorFLs result. So this may actually work.
1:40/100m was 22nd, and matches a 4:03/km, which is a bit faster than GatorFLs idea, but not entirely different.
So that could be a winning technique too:
Find out what position the pace per mile would get at a some large triathlon
Find out how fast the equivalent swimmer position went.
Conversion complete?
Again, I’d say it is really hard to do this conversion. From my swimmer’s perspective, many of the converted swim times seem way too slow compared to how hard I think the run times are. But I’m certain someone looking at it from a track perspective would think the converted run times seem way too easy compared to the swim time they came from.
I wonder if you could use short tris to try to figure out comparable times.
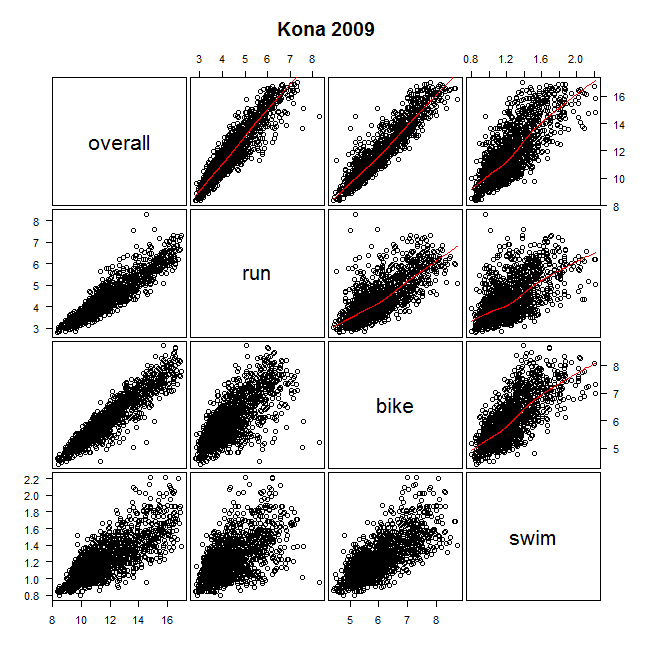
Or maybe long, especially since you’re not talking about sports-specific WR times. Note that the swim-run correlation isn’t as strong as the bike-run correlation.
Hmmm… What are you trying to figure out? I can guarantee you my equal effort swim times and run times would not follow any of this math. I’m a 55min IM swimmer and on a good day can barely tun a 8:00 mile for a 10K and those efforts are not the same.
Are you looking for some kind of “A good swimmer is a X:XX 100m guy and a good runner is a Y:YY/mile guy”? The other thing you have to look at is distance too.
For an individual I dont’ think you can equate swim times to indicate run times. At least not for me.
If you look at 3:43 is = to 15:00 then you would say 7:36 is = 30:00! I can run 7:36 miles all day long, but it doesn’t take me 30 minutes to swim a mile.
I can run an all out mile at about 5:15-5:30 for one mile. I can run 6:45 minute miles for a 10K. My mile time in a swim is about 28:00 minutes consistantly. Sometimes I can swim 27:00 depending on how good I feel. These swim times are in a pool btw.
Converting like that is fairly accurate for me and probably anyone who swims and runs. For someone who has only run and never swam before it obviously wouldn’t work.
I wonder if you could use short tris to try to figure out comparable times.
Or maybe long, especially since you’re not talking about sports-specific WR times. Note that the swim-run correlation isn’t as strong as the bike-run correlation.
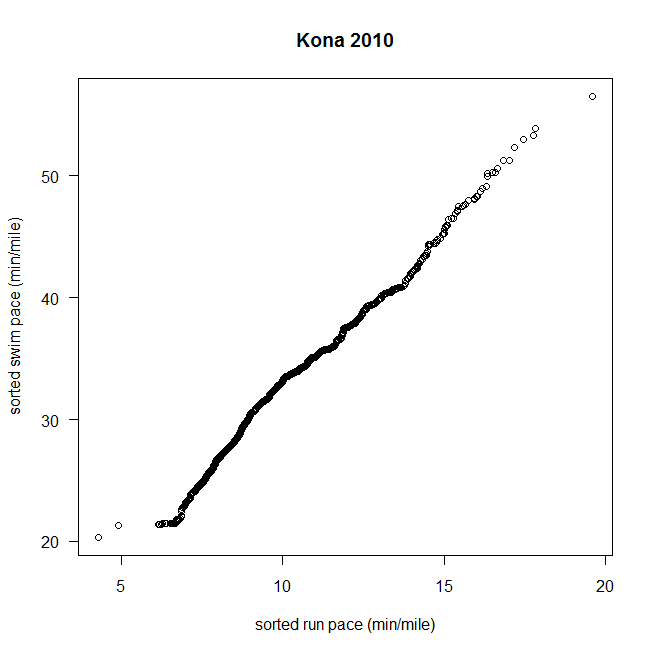
The key was that I was going with positions, rather than athletes. So in essence I was using percentiles, and saying “a 95th percentile swim is _____, and a 95th percentile run is _____ at a given tri”. It would be interesting to run a script and see if the swim<->run conversions from this approach are consistent from tri to tri. I think it would give a less-messy scatterplot than graphing it by athlete, since most athletes are specialists at one or the other.
A plotting algorithm would be for each position n in the tri, plot the speed of the nth runner and nth swimmer together. Then do that for all the tri results you can find, then do a regression fit and call that your conversion function.
I wonder if you could use short tris to try to figure out comparable times.
Or maybe long, especially since you’re not talking about sports-specific WR times. Note that the swim-run correlation isn’t as strong as the bike-run correlation.
The key was that I was going with positions, rather than athletes. So in essence I was using percentiles, and saying “a 95th percentile swim is _____, and a 95th percentile run is _____ at a given tri”. It would be interesting to run a script and see if the swim<->run conversions from this approach are consistent from tri to tri. I think it would give a less-messy scatterplot than graphing it by athlete, since most athletes are specialists at one or the other.
A plotting algorithm would be for each position n in the tri, plot the speed of the nth runner and nth swimmer together. Then do that for all the tri results you can find, then do a regression fit and call that your conversion function.
The other cool thing about that approach is that your data should be mostly mergeable with any other race - if 60th percentile is doing 1:50/100m and 4:00/km at Kona, it should still merge with another race where that’s a 95th percentile performance. There would be small variations depending on whether a given race had a hard run or long/short swim (so 1:50 might map to a slower run time than usual), but the overall shape should remain consistent, I’d think.