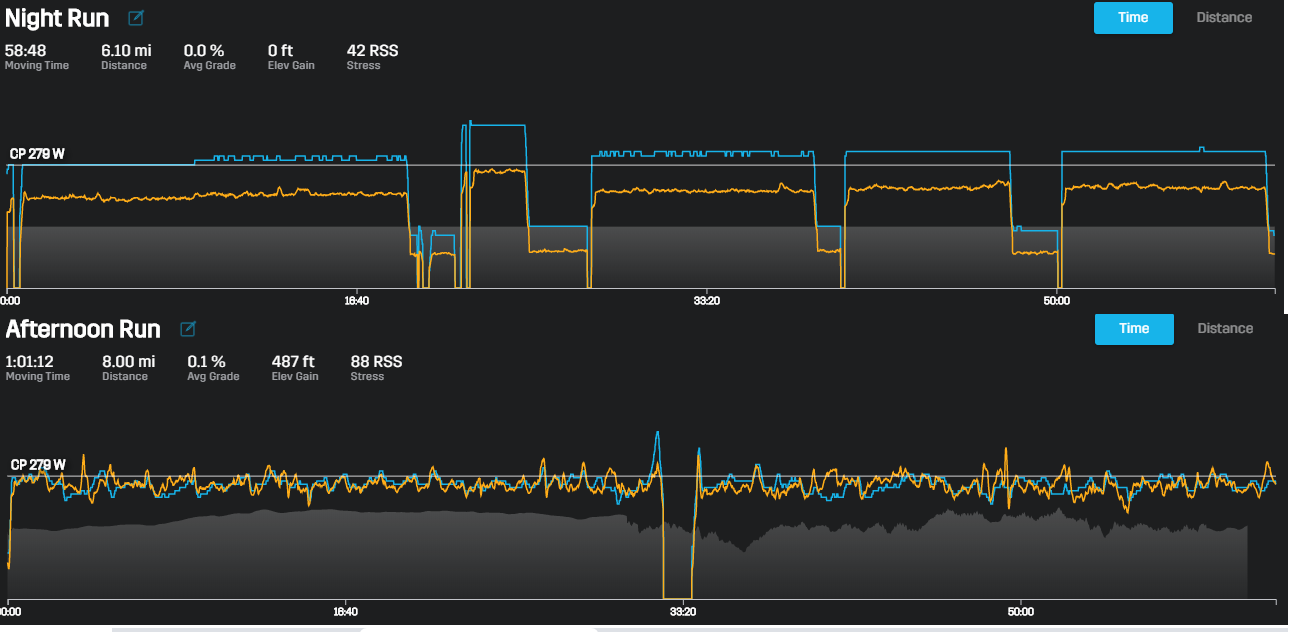
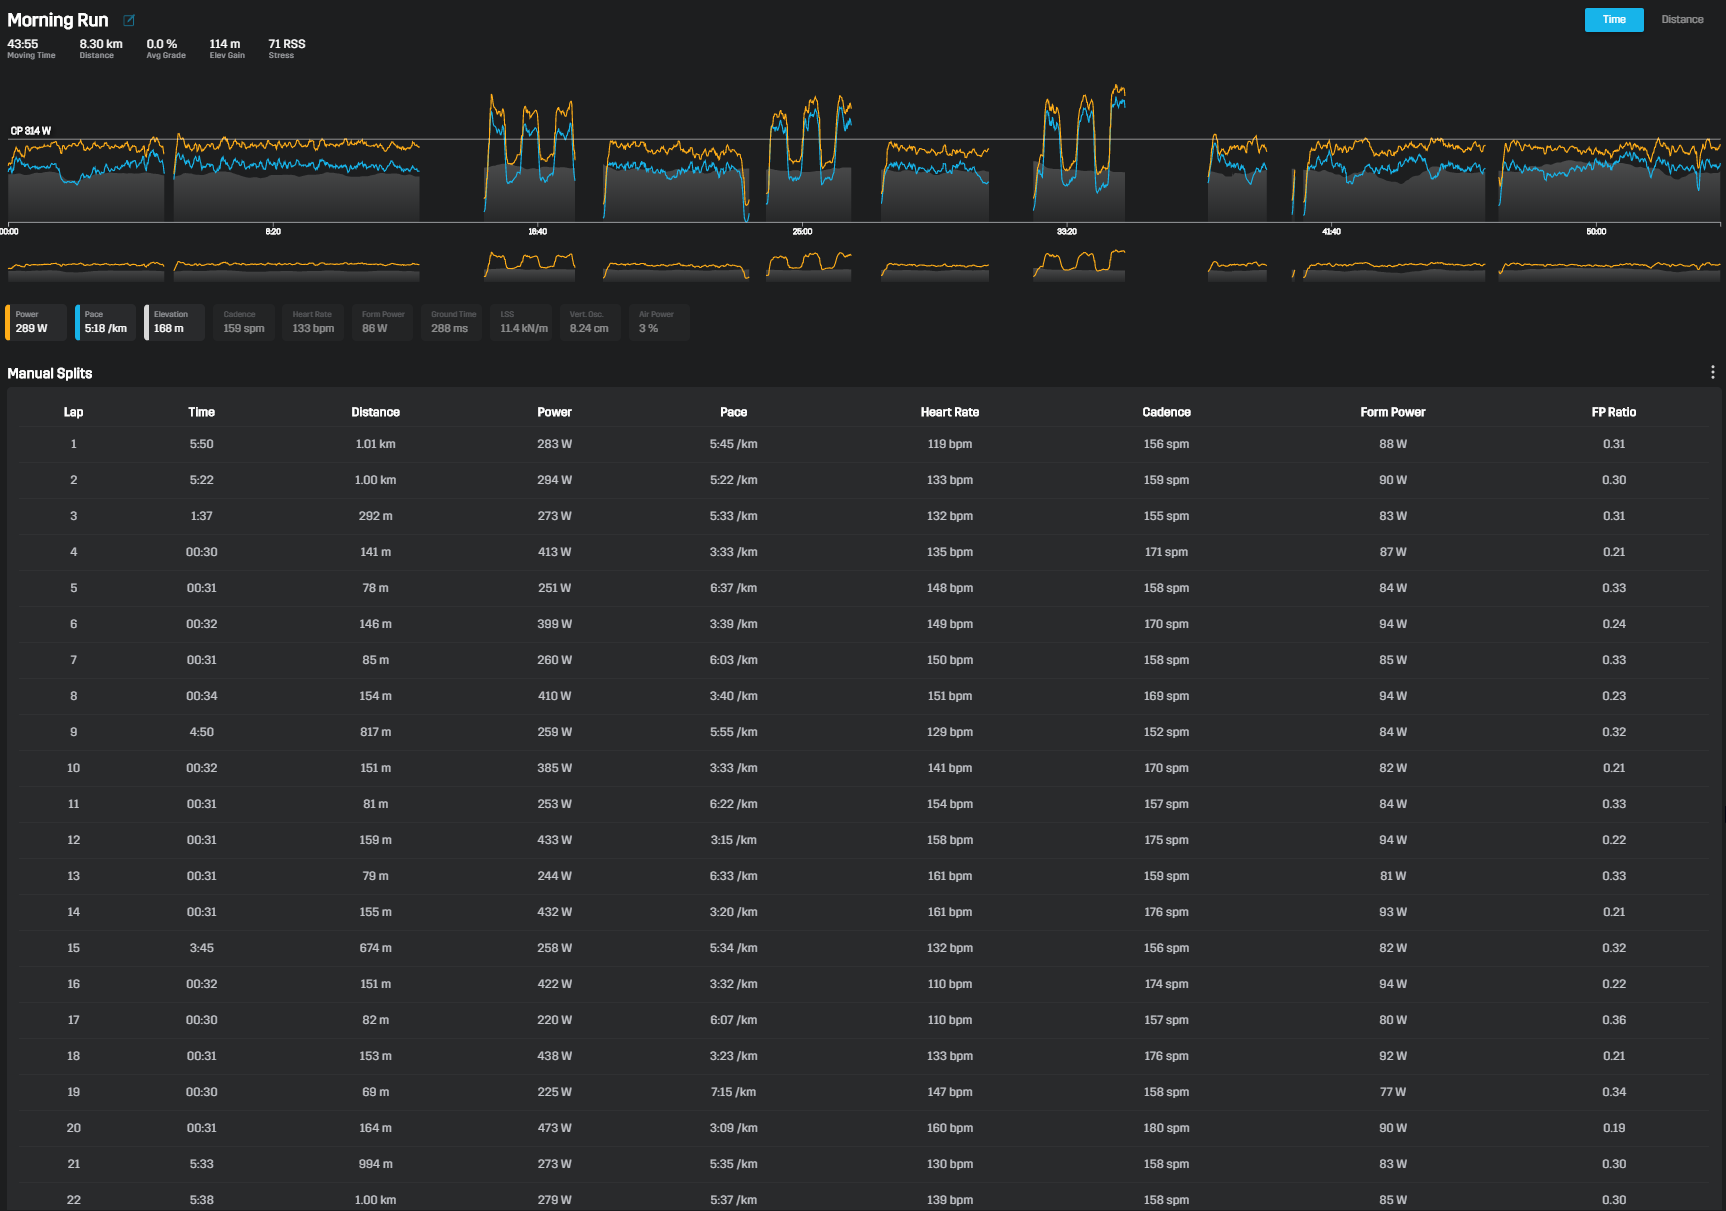
I track the stuff below. I think this is from Jim Vance’s book.
I try to track my runs based on whether they are z2, z3, z4 intervals. For reference I’ve been using the 8020 plan. These are the parameters I follow. The first 1/2 are calculations (I found on someone’s podcast several years ago) based on the second 1/2 variables. Obviously For the nerd in me, it just gives me more motivation to see in data form what I’m experiencing on the road. Helps me to stay with the program when I see improvement. Also allows me to know where I am compared to the past. To me it’s no different than looking at past years and seeing what I was doing on the bike.
Efficiency Index (EI) Efficiency Index compares speed per watt. Speed is calculated in meters per min. Increases in value show improved efficiency
Efficiency Factor (EF) Efficiency Factor is the difference between normalized power and HRavg for the workout or selected work segment. Increases in EF shows improved efficiency
Running Effectiveness (RE) It is calculated as the ratio of speed (m/s) to power (W/kg or (Nm/s)/kg), resulting in the units of kg/N. It can be viewed as the inverse of the effective horizontal retarding force that a runner must overcome to achieve a particular speed. For most experienced runners, RE is typically close to 1kg/N. RE may be lower in novice or fatigued runners since the do not travel as fast for a given power output or must generate more power to achieve the same speed. RE may alos decline slightly at higher running speeds, when running above critical pace, for example.
*Power (w/kg) Running power relative to body mass. Note that because of energy recycling via the series-elastic elements of the musculoskeletal system, sustained running power is often signficantly higher than cycling power, even for the same individula. On the other hand, due to the way the data is smoothed or damped, power at the very short durations is generally lower.Duty Time (%)As indicated above, shorter ground contact times may be associated with better running economy. Hoever, ground contact time vaires somewhate based on running speed, making it more difficult to interpret. *
Duty factor, OTOH, is the percentage of teh total time between steps or strides that the foot is on the ground. As such, it somewhat less dependent on actual running speed. Values for duty factor can vary from 50-90 percent, but are typically in the 60-80 percent
Flight Time (%)This is the time during which both feet are off the ground. All else being equal, a greater flight time might be associated with better running economy, since at a given step or stride frequency, flight time and ground contact time are inverse to each other.
Stride RateAlso termed stride rate or, outside of the scientific literature, cadence.
Normalized Power (NP)NP is the estimate of power that you could have maintained for the same physiological “cost” if your power had been perfectely constant.
Form Power FP is essentially your “running in place” power. Decrease in your form power over time, when running at similar training speeds, is a good indication that you have improved your running economy. Highly trained and economical runners may already have near optimal funning form but can monitor how form power changes with fatigue.
Ground Contact Time (ms)Also called stance time, this measurement reflects how long the foot is in contact with the ground, starting rom the initial “crash” phase as the runner touches down and ending with toe-off. Values are typically in teh 150-350 ms range, although this varies somewhate based on runnning speed, etc. Ground contact time is of potential interest because studies in the literature suggest that shorter ground contact times may be associated with a lower metabolic cost to run at the same speed.
*Leg Spring Stiffness (LSS)Think of your leg as a spring upon whihc your body “bounces.” The stiffer the spring, the less energy you must produce to propel yourself forward with each step. this new metric measures the stiffness of the muscles and tendons in your leg. Increases indicate economy improvement over time. *

