Single-sided power meters

In defending single-sided power meters, people often say their single-sided PM is off by only a couple percent compared to a both-side PM or a smart trainer. They usually conclude “all you need is consistency, not accuracy.”

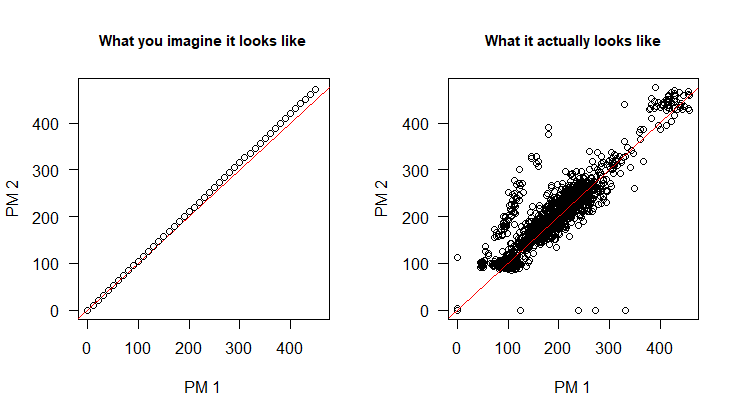
Here are some data from an actual comparison of a single-sided and crank-spider (i.e., both side) power meter. The overall difference between the two was something like 3 or 4 percent, so the left panel shows PM2 with a slope of 1.03 compared to PM1. (I actually don’t remember whether PM1 or PM2 was the single-sided – but it doesn’t really matter for this). The right panel shows the actual second-by-second data. The axes in both panels are in watts.

imagination_vs_reality.png

Interesting.

What is the source of the data? Is it one rider or many? What kind of riding was measured?

Wondering what the right graph looks like with 3s/5s/10s smoothing, since these are often applied.

One rider. Indoor ride – outdoor rides are even more variable because of greater accelerations/decelerations.

This is why I say what’s important isn’t how close two power meters are on average; these two are close on average. What’s important is knowing when they’re different, and by how much.

I do think it’s important, if I’m understanding what you’re saying, is that it’s second-by-second data here. That’s a really, really short time interval.

For a 3-second smoothed interval, I don’t think that graph is representative. For sure, I, and anyone else with a SS PM, would 100% notice and be totally shocked it we were cranking out 200,300 watts but the actual ‘real’ power was a mere 100 watts in the display even for a 3second avergaed readout. That’s just too big a power gap to think anyone would be pedaling away happily and not thinking “WTF” when the power fluctates by 100+watts as frequently as that graph implies. There are quite a few points on that graph where one PM display 400 watts and the other is 200 w (or 300 vs 100w) - there is nobody on the planet that would mistake the two in a 3-second smoothed power interval, meaning they’re comfortably cranking out a steady 200 watts, and then suddenly the PM shows 400 watts on a regular basis for the same effort.

I could def see though, that if you’re a sprinter doing huge quick power spikes that are short, yes, the DS will outperform the SS, by how much, I’m not sure, but I’d still be surprised if it was in the 100+watt range for those sub-second recordings.

Would you happen to know what caused the cloud of points above the Y~=X line? I would guess the rider unconsciously favors starting efforts with one leg, which I think I do when doing sprint intervals, though I can’t tell you which leg I favor.

As an aside, every time I see weird PM data I wish that they still made PowerTap hubs. They were the equivalent of the treaded bottom bracket while everything else was/is like PF30.

This is outstanding analysis. And, I love that you properly use “data” as plural. That is extra data science cred. :wink:

That’s way too much data for my simple brain. I know from personal experience that a single sided (left side) Stages did not work out well for me.

I’ve been riding with power meters for 10+ years - always some version of PowerTap rear hub, Computrainer or direct drive trainer. I’ve got a good general sense of where my numbers should be for a given RPE. Anyways, a couple of years ago, in order to save a bit of money, I put a Stages on one of my bikes. Immediately the numbers were wildly off (20-30 watts high) for every ride compared to what I would have expected given past experience. It drove me absolute bonkers and I eventually sold it.

A few months later I got a set of the Assioma Duo pedals which returned values I would have expected given past experience. After awhile I realized the Duo’s had left/right balance and noticed that nearly every ride with about 55/45 left/right balance. In other words, I’m left side dominant. If the Stages was simply doubling my left side power, it’s no wonder the numbers were much higher than expected.

Smoothing is irrelevant as it masks the inaccuracy and variances. The goal is to get the raw data (1 sec data) accurate. Once you do that, everything else falls into play quite nicely.

My only question is why the 4 points along the bottom (PM2=0, PM1>0) were included? It probably is negligible in total, but these points help pull the average back towards 1.00. The cluster of points around the 2.00 are more troubling, as that looks less like a error and more like a systemic difference.

I’m a little confused. I understand the right panel, described as “actual second-by-second data.” What’s the left panel? Averaged? Over what time interval?

Smoothing is irrelevant as it masks the inaccuracy and variances.

Depends on the smoothing method used. A mean or median filter, I’d agree. But something like a Kalman filter can produce a more accurate estimate and also has a smoothing effect.

And the one second data almost certainly isn’t really “raw data.” I’d assume the underlying microcontroller samples strain gages and rotational estimates at more than 1000Hz. So the “raw data” is already likely the result of some kind of integration of thousands of samples into one number.

Well Robert now you’ve done it… my small brain is trying to make the leap to the quantum state of yours and well we are frankly falling short. On the left I see a slight bias, the lines are both straight just a % bias which gets more obvious as the value rises, but the % seems constant.

In #2 I see a bunch of data points that show that PM 2 is reading considerably higher than PM 1… also oddly there are 4-6 points where PM2 read near zero and PM 1 read significant numbers. There are some definite (again in my limited math mind) outliers in the data. There is also the troubling 2x data for PM 2 vs PM 1 ie PM2 reads 400 PM1 reads <200. Based upon this alone I would suspect PM2 is the single sided because it simply did a doubling? of a weird data point so that is why the cluster of outliers above the main data line, it is probably single sided multiplication errors as well as the data point not being in sync? ie it is because of the pedalling phase that they are unable to be in phase… left only gets 1/2 as many readings significant force reading ie in p\the power phase of the pedal stroke while in dual sided that happens 2x as many times.

I do not disagree that single side may not be as good as dual and that is why I have dual side on my bikes if as in my case you can see left vs right data it should show the device error, what it appears you may be showing is the single side double of errors, again not arguing your point trying to grasp your data…

A lot of people seem deeply attached to their single-sided power meters, even though the difference in price is no longer that compelling and many of these people probably think nothing of spending big bucks on other aspects of their equipment. They’ll say it works for “99%” of riders. But in our household we’re two of two for single-sided providing junk data due to a dominant leg. I came up with 9-11% inflation in average power, but it wasn’t linear, the difference was most pronounced at low power and much closer at high power, so a simple scaling factor wouldn’t work. But people believe what they want to believe.

Here are some data from an actual comparison of a single-sided and crank-spider (i.e., both side) power meter. The overall difference between the two was something like 3 or 4 percent, so the left panel shows PM2 with a slope of 1.03 compared to PM1. (I actually don’t remember whether PM1 or PM2 was the single-sided – but it doesn’t really matter for this). The right panel shows the actual second-by-second data. The axes in both panels are in watts.

I suppose the data is corrected for time jitter? How does it look with two dual side power meters?

Anyway, if I can choose between estimating power and measuring power I would measure power even if it somehow more expensive.

Anyway, if I can choose between estimating power and measuring power I would measure power even if it somehow more expensive.

It’s all estimation. Just a matter of how accurate. I.e. strain gages and accelerometers do not directly measure power. But I can certainly see one leg as a “bridge too far” in terms of what you can get away with for minimally acceptable accuracy for some consumer-grade purposes.

Edit: Sorry, that was pedantic. It’s just that as an engineer, I don’t like the pejorative use of “estimation.” Achieving something close to optimal estimation of some quantity you’re trying to measure/estimate is near and dear to my heart and estimation theory is a noble application statistics.

I don’t think this is a very insightful way to view the data…it would be better to show how the two compare over several seconds at any area of interest. For example, where you have a (200,400) data point, what happens around that time? Is the 1S leading/lagging the 2S and they converge within a few seconds? If that is the case (and I think it is) then it doesn’t really make much difference for most cyclists, it is still giving an accurate representation of the effort and power. My smart trainer graphs never show much difference between L and R. I’ve had single sided meters before and still think they are perfectly adequate and better bang for the buck.

Smoothing is irrelevant as it masks the inaccuracy and variances. The goal is to get the raw data (1 sec data) accurate. Once you do that, everything else falls into play quite nicely.

I’d opine that it is very relevant given the variance in power application with crank angle, and the low frequencies riders pedal at (compared to car motors or electrical AC frequencies).

Take the following, simplified example. A rider is pedaling steadily at 200W; each leg does 200W on the downstroke and 0W on the upstroke. The rider is pedaling at 90rpm, so one second the single sided PM sees two downstrokes and one upstroke and the next second one downstroke and two upstrokes. The result would be very different power readings even though the rider is putting out constant power for each second. That is why smoothing is needed.

Here are some data from an actual comparison of a single-sided and crank-spider (i.e., both side) power meter. The overall difference between the two was something like 3 or 4 percent, so the left panel shows PM2 with a slope of 1.03 compared to PM1. (I actually don’t remember whether PM1 or PM2 was the single-sided – but it doesn’t really matter for this). The right panel shows the actual second-by-second data. The axes in both panels are in watts.

I suppose the data is corrected for time jitter? How does it look with two dual side power meters?

Anyway, if I can choose between estimating power and measuring power I would measure power even if it somehow more expensive.

I’d like to know more about the testing methodology.

What was the time source? Was it the same source for both? How did they account for jitter and drift? What is the lag from the generation of the data to the collection? How did they account for the different “trade secret” smoothing algorithms that each power meters are using? What was the actual sampling frequency of each power meter?

They usually conclude “all you need is consistency, not accuracy.”

So are single sided power meters inconsistent, especially when pedaling smoothly >60rpm? I don’t much care if my left sided meter reads low when I use my right foot starting out from stoplights or am lazily standing on the pedals as long as I’m in the correct zone when cruising at speed…

No they are not. At least both my Assioma Faveros are SUPER consistent, even with triathlon interval work down to 30 second sprints. You cannot go wrong with it as a triathlete.

Bottom line - SS works MORE than fine, it works spectacularly well for an AGer training to use a PM efficiently. Full stop. Anyone who tells you otherwise with regards to a SS Favero Assioma is lying or has never used one properly/extensively.

I have had ample experience with Powertab hub (dual measurement), Kickr (dual measurement), and 2 Favero SSs, and they all line up really well, particularly the 2 Faveros which are so close that I can’t tell the difference. This is for indoors, outdoors, and all my intervals.

Am I going to say the SS Favero meets the rigorous demands of a mechanical engineer using it for industrial purposes? Of course not. But does it meet the essential needs of a AG triathlete that wants good, highly reproducible data that can assess and guide training - heckkk yes.

I easily had/have enough money to buy the Favero DS for both my bikes, but have had literally zero need to do so. I’m sure some folks out there will say I’m fooling myself , but my power data from 2+ years both indoors and outdoors is shockingly consistent. The data for training was good enough such that I won the bike split of a local Oly in Norcal based on it, something I’ve never done in 11 years of tri before.

I don’t do criteriums or other bike sprint efforts, but I could see how super-high power bursts might be prone to more inaccuracy between meters, so I wouldn’t go so far as to say a criterium rider can trust a SS fully compared to a DS. But for a triathlete that does 99% of their riding with longer than 30 second intervals, it’s all good.