Silca tire pressure calculator beta

Yep…any energy making it past the tire is going to be mostly absorbed and not returned.

Here’s the thing about roller testing…it’s a GREAT way of determining the hysteresis losses from deformation and ranking tires. If you add in additional “roughness” to the test setup that increases the deformations, it’s just adding additional hysteresis losses in a proportional manner, and the rankings don’t change. This is why I’m not a fan of adding “roughness” to a roller test. It doesn’t add any additional information.

Yup… the rankings don’t change… but as you say the magnitude of the wattage changes… you obviously have more experience with this than me, so I assume this to be generally true, is strictly true in your experience…?

Interestingly, I noticed that generally tire rankings don’t change with pressure… BUT, some actually do… some tires change their ranking based on tire pressure…

https://www.bicyclerollingresistance.com/...reviews?orderby=rr60

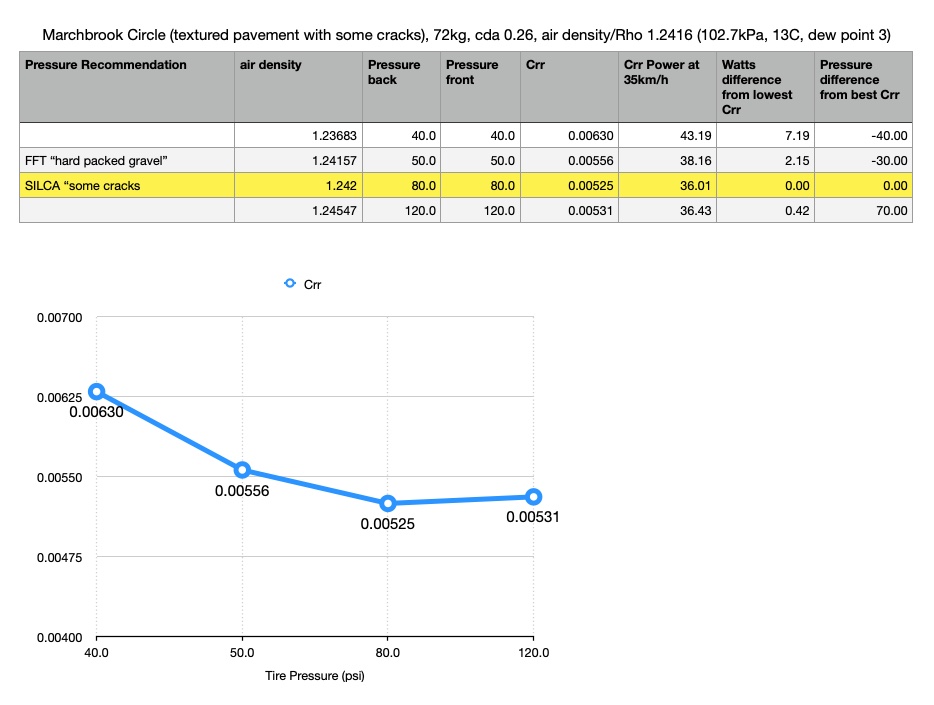
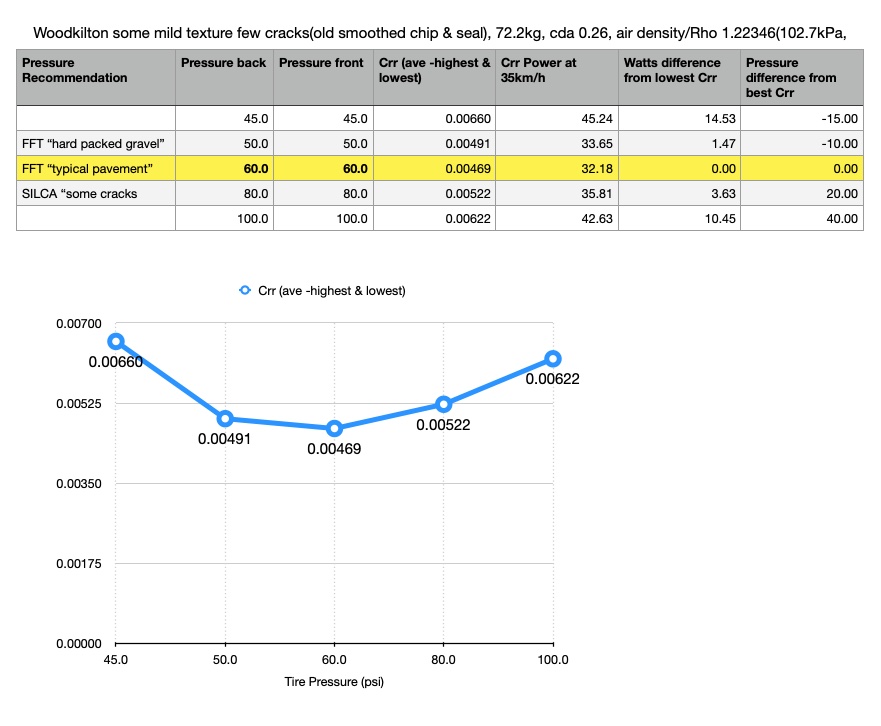
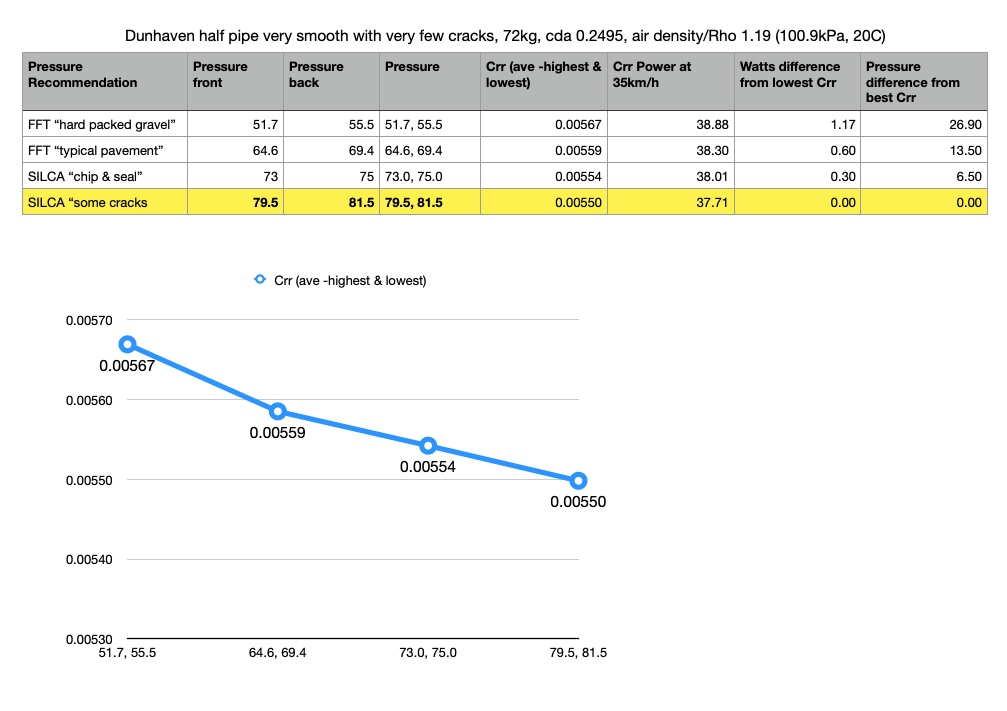
I’d be careful about drawing any conclusions based on values from over such a wide pressure range (especially considering the magnitude of differences shown, i.e. tenths of watts). Although that wide range might be interesting…I find it useful to compare the tires in a pressure range they’d most likely be used for the majority of riders.

so wonder, could there be tire characteristics that allow it to isolate the bike better or worse from road… and that don’t vary proportionally with the its hysteresis characteristics…?

That “characteristic” you’re talking about is the air spring “stiffness”, AKA “pressure”…so, if you need better isolation, choose a wider tire so you can lower the pressure.

Wondering if you could create a rig where you quantify the hysteresis losses on a textured drum… but also quantify the isolation characteristics and therefore the non-hysteresis losses of the tire with an accelerometer and/or strain gage attached to the wheel itself… then have maybe 4 standard textured drums that you could use to test… then get a better TOTAL picture of how a tire is actually going to roll… what pressure a tire rolls best at on given terrain etc…?

Interestingly it seems even the shape and size of the obstacle seems to impact the forces in non-tribal ways… maybe even using a drum, through practical, might not realistically mimic real world closely enough for this type of testing… maybe the on bike, black box type testing where you just look at input and output is best…?

https://blog.silca.cc/...r-is-stiffer/harsher

But, there has gotta be a better way of testing tires… what is done now is really inadequate and we know only captures about half of the story… as some people were talking about for a decade already 😉

I think you might be over-thinking it :wink:

The way tires are tested now IS pretty good…it’s just that too many people don’t have the insight to understand how it relates to “real world” conditions…and they keep trying to add in surface roughness, etc. to the testing.

It’s actually pretty simple. Smooth roller testing give you an idea of the hysteresis performance on hard surfaces (smooth or rough). With field testing, one can then also find out where the “breakpoint pressure” of the system is…and then just make sure you stay far enough away from that for the given speed, surface, and load.

Now then, if you want to talk about how tires perform on dirt…that’s a whole 'nuther ballgame…but, not impossible :slight_smile:

I think you might be over-thinking it :wink:
Weird… never heard that before 😉

So I’ve tried my hand at a Chung analysis… was fairly painless and I was already a user of Golden Cheetah for my performance management software and it’s just included in there as one of the tools.

What would you suggest as a user friendly method for finding breakpoint?

The way I found it originally…VE (“Chung”) analysis at different pressures.

But, THE most user friendly method would be to just use the Silca pressure calculator :wink:

The way I found it originally…VE (“Chung”) analysis at different pressures.

But, THE most user friendly method would be to just use the Silca pressure calculator :wink:

Makes sense… thanks so much for your input, it’s been quite educative,

…and thanks for “overthinking” this 😉 we wouldn’t have our current understanding without people like yourself tinkering around with this stuff and the out of the box thinking 🍻

Just came across this thing, figured I’d try it out and see what I was doing wrong.

Interestingly, it spit out almost exactly the same pressure that I’m using now. I’ve been using 100psi on nominal 23mm, 24mm actual width. calculator says 100.5 psi front, 103 psi rear.

Also, I wanted to see what it came up with for my race wheels, if we ever get back to racing. 21mm width (nominal and actual). If I pick Cat 1/2/3 racing - I’m up to a whopping 125/128 at my current weight (triggered the pinch flat warning, but not an issue for tubulars).

I really should get wider tubulars, but these are NOS, never even been glued yet. given that they are tubulars, I could run a bit lower pressure than that, probably 110-115???

Oh man, I’ve been driving an RV across the country for a friend for the last 3 days and totally missed this tire pressure party!!

For s5100e… the calculator does have a pinch flat predictor… this is run by an energy equation that take tire spring rate and radial height and then compares compression energy to rider mass/velocity. Early versions of the calculator had an ‘average speed’ entered as a velocity number, but since the energy calculation is taking ‘average’ velocity and then assuming a velocity distribution based on that number, people were always tripping the warning by saying they rode at ‘average speed’ of 25mph…

As for the rest of it, the problem with impedance is that it really encompasses 3 components, 2 rider related and 1 tire related:

  1. High vertical accelerations make for extra high Crr numbers, so to Tom’s broomstick analogy, normal Crr is the difference between energy put into the tire to make the contact patch vs energy given back by the tire as it returns to shape. But in the impedance realm, the vertical forces can be so high that the tire is off the ground when it gives back that energy…so if you high speed a tire hitting a broom stick, you see this massive compression against the tire both vertically and diagonally against the direction of motion, followed by the tire going ‘airborne’ over the other side of the broomstick and the tire regaining shape before hitting the ground… so NONE of the energy is going back.
  2. Rider contact points: different riders will have different contact point hysteresis and different stiffnesses of bike will affect this as well. Ride the Carrefour de l’Arbre 1 time and your hands will be hot and blistered… this is hysteresis
  3. Rider body composition hysteresis. This is perhaps the biggest question using our data… nearly all of our data comes from world class athletes and even the non pros on our list are guys/gals with some serious fitness and palmares. This is important if you think about hysteresis as damping… the more fit you are the lower your body damping coefficient will be. To a 180lb person who is 2% body fat will have lower damping than a 180lb person who is 20% body fat, so in theory this should likely move the break point lower for higher hysteresis people and higher for lower hysteresis people… and looking at the athletes on our list, they are by and large about the lowest hysteresis people you could find!!
  1. Rider body composition hysteresis. This is perhaps the biggest question using our data… nearly all of our data comes from world class athletes and even the non pros on our list are guys/gals with some serious fitness and palmares. This is important if you think about hysteresis as damping… the more fit you are the lower your body damping coefficient will be. To a 180lb person who is 2% body fat will have lower damping than a 180lb person who is 20% body fat, so in theory this should likely move the break point lower for higher hysteresis people and higher for lower hysteresis people… and looking at the athletes on our list, they are by and large about the lowest hysteresis people you could find!!
    I wonder about that. If we’re talking about something as high-frequency as paved road irregularities, is the rider’s body actually a responsive enough part of the system that rebounded energy would be meaningfully biased toward returning as forward motion? I wouldn’t be surprised if a lower-hysteresis body just means that the energy bounces around longer before being dissipated.

Hi Josh, thank you for chiming in. The whole discussion of body composition and contact point hysteresis is very cool latter probably ripe fit innovation to mitigate!

Wondering about the case with the broomstick. In the case where the wheel hits the broomstick, tire doesn’t fully compress and the bike is lifted up & over the stick (launched in air or not). When the wheel hits the broomstick there is a diagonal vector at the point of contact the vertical component of that diagonal vector is the force available for lifting the bike up and over… but there is a horizontal component to that vector pointing straight backwards, opposing forward motion. This will impart an Impulse (F.dt) on the bike… basically bike and earth exchange some momentum and bike slows down…

a) is there something wrong with this thinking?
b) do you account for this type of “collision” type of interaction in your impedance thinking, modelling?

Hi Josh, I am not certain why when I pull the SPPC up I no longer see the pinch flat side bar when I enter the pro version. As for speed I was referring to a speed range or average, not an absolute number assuming a fast group ride is a range depending upon what is fast??? my fast is not real fast and so it is a bit hard to relate those numbers. So what I mean is have both the text as well as the intended speed range. But i note that say between recreational and fast group is only 1.5 psi front and 1 psi rear so if I assume the slower then I am still on the correct side of the breakpoint.

For the Rider hysteresis maybe add in BMI? :wink:

Thanks for the calculator I swear by it even though I am not certain I interpret it all correctly I typically look at what the result is an how sensitive it is to the areas I am uncertain in.

Did some more testing this weekend on more typical road surface and wider range of pressures… not lining up with Silca calculator at all actually… actually getting that 20-25psi diff… want to do that do one more set of testing… just to make sure…

found some more advice on crunching data here:
http://www.floataero.com/fahome/wp-content/uploads/2016/10/Three-testing-scenarios.pdf

Got a bit busy…

Three trial… getting better at doing these I think…

I have gone back to thinking the Silca calculator reads high 15-20psi for riders of my weight ~60kg/72kg (bike+rider)

Some of my observations/conclustion:
on very smooth pavement ~80ish psi tested lowest Crr, but the difference in Watts between 60-80 was less that a Watt… imho 60psi would be the better practical choice given 1) comfort & fatigue 2) likelihood of mixed road texture over totality of ride meaning that over the ride a lower pressure would be better performing 3) almost no performance penalty for going to lower pressure… ~80psi is what silca recommendson textured pavement with some cracks 60psi (vs ~80ish psi to 73psi as predicted by Silca calculator) seemed to be the better choice over two trials…I observed a bowl shaped curve, but did not observe the steep, marked impedance increase as seen in other’s analysis… still improving my process at getting better data… so work in progress… I have pretty low BMI so could some of this effect be much lower for me??

MarchbrookCirSept14.jpg
WoodkiltonSept11.jpg
Aug30Dunhaven.jpg
pressureRecommendations.jpg

Yep…any energy making it past the tire is going to be mostly absorbed and not returned.

Here’s the thing about roller testing…it’s a GREAT way of determining the hysteresis losses from deformation and ranking tires. If you add in additional “roughness” to the test setup that increases the deformations, it’s just adding additional hysteresis losses in a proportional manner, and the rankings don’t change. This is why I’m not a fan of adding “roughness” to a roller test. It doesn’t add any additional information.

Imagine you must have been in loop for this since they quote your work and Josh’s work quite a bit… tested on textured drums to simulate cobbles… BUT also add a shock absorber to simulate body hysteresis… the “over thinking” test I was suggesting… does seem to add imho significant additional info 🤔

Super interesting that
breakpoint is not just a matter of road roughness, tire width and rider weight… but also seems to be an inherent characteristic of the tire itself and it’s construction as well… all thing being equal different tires constructions will have different breakpoints!As expected, wider tire will have a lower breakpoint pressure, but (as I expected) will have a lower power number at it’s break point pressure as well…
Main article link below… need a membership to see the actual testing results…

https://www.velonews.com/...ols-when-testing-it/

I was only asked to review and comment on the article AFTER all of the testing was done (as was Josh).

That said, one thing that probably didn’t make it into the article which Josh had pointed out, is that although the Wheel Energy test rig does have a bit of damping inherent in the load application (due to the use of an air cylinder), the amount of damping supplied is basically an order of magnitude lower than what would represent the damping of a human body. This will have a pretty large effect on the absolute breakpoint pressure for a given roughness, load, and speed.

So, although they appear to have found a breakpoint pressure with the rig, that still doesn’t really give any actionable information…

I expressed my opinion about the necessity of “rough surface” testing at the time as well…but, I’m pretty sure the VN folks are of the opinion that it’s hard to convince people without having something like this, for many of the same reasons I pointed out a year ago (i.e. lack of understanding of the loss properties of tires by the consumer).

Oh… ok…

I had the same suspicions as you state here…
does that air cylinder REALLY add hysteresis in remotely same range as a human body? thought, not likely, but didn’t really have details on that.The values surfaced really don’t have any absolute value anyone should take and use to set up their actual tire pressure… that those breakpoint pressures likely can’t be taken at face values…BUT… that being said… what I found it interesting is that it does let us do something that’s hard to do otherwise… set all variables constant and see if tire construction itself has inherent characteristics that can affect break point pressure and this testing would seem to indicate… YES, it does… and seems that it’s NOT necessarily correlated directly with crr.

So it’s not just a matter of rider weight, tire size, surface roughness… seems the specific tire construction also matter in picking optimal tire pressure… that is something new… no? Not sure they recognizes that as something new in the article… wasn’t highlighted, but a question I was asking earlier and seems we have at least a preliminary answer… and I think the popular assumption was that the tire construction didn’t matter WAS just directly correlated with crr… but this testing would seem to indicate that is not be the case.

Right…but are you trying to find the tire with the best Crr, or looking for which has the highest (or lowest) breakpoint pressure?

In other words, let’s say you have 2 tires and one is 1W per tire faster, but the other has a breakpoint pressure 5 psi higher (even though BOTH breakpoint pressures are most likely well above typical pressures you’d run on surfaces where breakpoint is a factor)?

I don’t know about you, but I’d still pick the one with the lower Crr…

Hmm. How accurate are the pump gauges?

I was only asked to review and comment on the article AFTER all of the testing was done (as was Josh).

That said, one thing that probably didn’t make it into the article which Josh had pointed out, is that although the Wheel Energy test rig does have a bit of damping inherent in the load application (due to the use of an air cylinder), the amount of damping supplied is basically an order of magnitude lower than what would represent the damping of a human body. This will have a pretty large effect on the absolute breakpoint pressure for a given roughness, load, and speed.

So, although they appear to have found a breakpoint pressure with the rig, that still doesn’t really give any actionable information…

I expressed my opinion about the necessity of “rough surface” testing at the time as well…but, I’m pretty sure the VN folks are of the opinion that it’s hard to convince people without having something like this, for many of the same reasons I pointed out a year ago (i.e. lack of understanding of the loss properties of tires by the consumer).

Oh… ok…

I had the same suspicions as you state here…
does that air cylinder REALLY add hysteresis in remotely same range as a human body? thought, not likely, but didn’t really have details on that.The values surfaced really don’t have any absolute value anyone should take and use to set up their actual tire pressure… that those breakpoint pressures likely can’t be taken at face values…BUT… that being said… what I found it interesting is that it does let us do something that’s hard to do otherwise… set all variables constant and see if tire construction itself has inherent characteristics that can affect break point pressure and this testing would seem to indicate… YES, it does… and seems that it’s NOT necessarily correlated directly with crr.

So it’s not just a matter of rider weight, tire size, surface roughness… seems the specific tire construction also matter in picking optimal tire pressure… that is something new… no? Not sure they recognizes that as something new in the article… wasn’t highlighted, but a question I was asking earlier and seems we have at least a preliminary answer… and I think the popular assumption was that the tire construction didn’t matter WAS just directly correlated with crr… but this testing would seem to indicate that is not be the case.

Right…but are you trying to find the tire with the best Crr, or looking for which has the highest (or lowest) breakpoint pressure?

In other words, let’s say you have 2 tires and one is 1W per tire faster, but the other has a breakpoint pressure 5 psi higher (even though BOTH breakpoint pressures are most likely well above typical pressures you’d run on surfaces where breakpoint is a factor)?

I don’t know about you, but I’d still pick the one with the lower Crr…

I would of course pick the tire with the lowest crr…

BUT then to get the best performance out of those tires I want to know what pressure to pump them up to… the initial subject of this thread actually! …having the knowledge that the breakpoint pressure and optimal tire pressure is not a function of crr, not a function of tire size means using those criteria to guide you could lead to wrong answer on optimal tire pressure… and that’s good to know!

example the Silca tire pressure calculator does not take tire construction into account (understand would not be reasonable to do that) so this could lead to inconsistent, error prone results… correct?

So reveals an inconvenient truth… takes us back a few steps in terms of convenience unfortunately… that the only accurate way to determine optimal tire pressure is field study… with the specific tires you want to use.

Just remember that the Silca calculator isn’t giving you the breakpoint pressure…just giving you the overall best pressure for your inputs, which I’m fairly certain is going to be quite a bit under any breakpoint pressure for those same conditions, because: " 'Tis far better to err on the side of too little, rather than too much, pressure" :wink:

True enough… after doing some of my own field test I’ve found that Josh’s advice that he gave as a guest on a YouTube channel was the best technique I have found to find optimal pressure… paraphrasing… ‘go as low as it takes so ride feels “smooth”… then go up if it handling feels wonky’

But as a bit of a biking science wonk… I find this finding in this testing really cool…

Found link (@10:44)
https://youtu.be/asEYkpW0vwQ?t=644