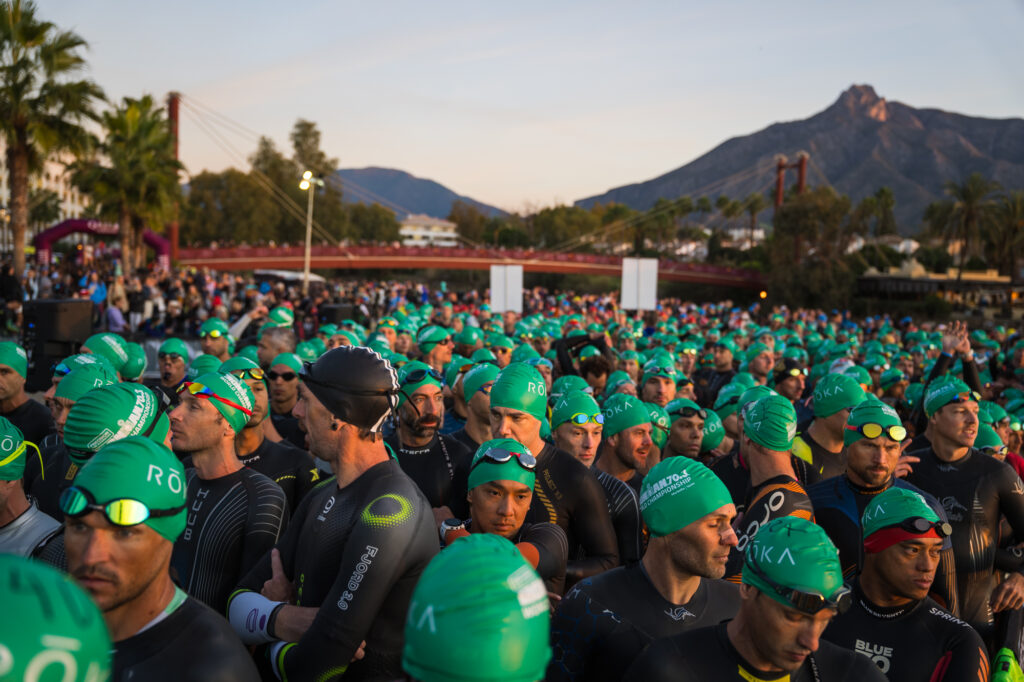
Lucy Charles-Barclay and Jelle Geens were just two of the 27 world champions crowned this past weekend in Marbella, Spain. There were 25 age-group championships earned this weekend, including those by a former IRONMAN professional world champion, and by a former Olympic gold medalist
2006 IRONMAN World Champion Michellie Jones earned her second straight IRONMAN 70.3 world champion, winning the women’s 55-59 crown. She had a nearly ten minute margin over second placed Rachel Crunk at the finish. On the men’s side, former professional cyclist and 2016 Olympic road race gold medalist Greg Van Avermaet won men’s 40-44 in his first attempt at the 70.3 world championship. Van Avermaet had a 4:40 gap over Wolfgang Teuchner.
The two overall age group champions were Corina Hengartner, who won women’s 45-49, and Samuel Studer, competing in the M18-24 bracket. Jan Tomanek won the men’s handicap category title; there were no women in the corresponding category.
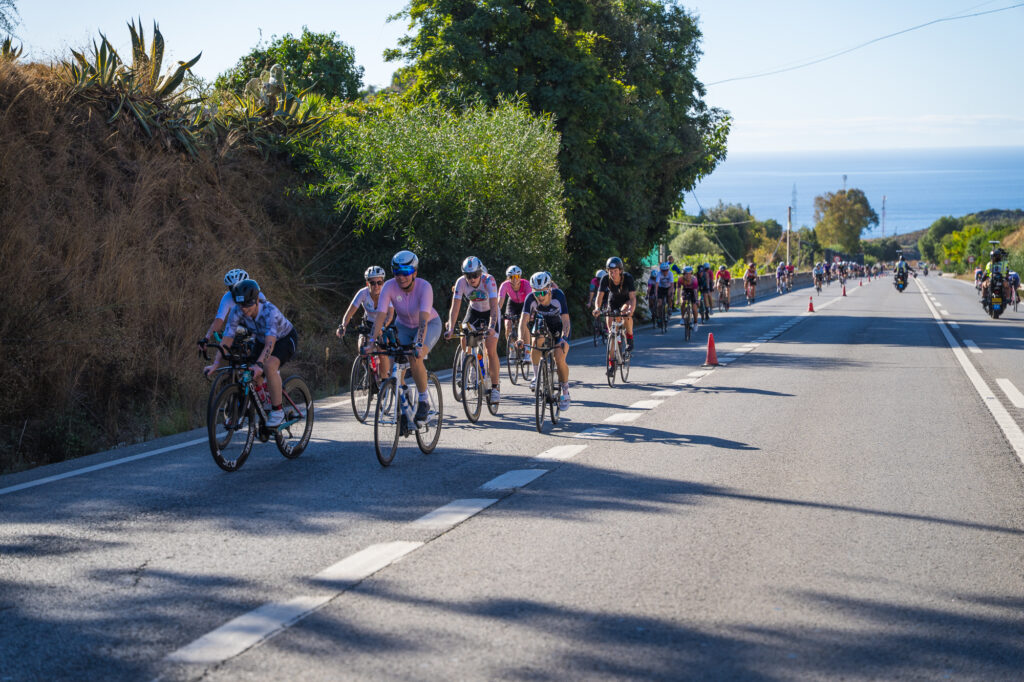
Despite having roughly a quarter of the total athletes racing, with nearly 1,500 athletes, the United States did not lead the championship table. France, who had the third-most athletes racing with 441, had the most age group winners, with two men and two women earning titles. Switzerland, the United Kingdom and United States each had three age group champions.
Below are the women’s age group champions.
Division
Name
Country Represented
Swim
Bike
Run
Finish
F18-24
Juliette Lucet
France
00:28:51
02:52:18
01:28:45
04:55:22
F25-29
Larissa Jasper
Germany
00:30:33
02:52:59
01:23:31
04:54:15
F30-34
Natasha Harris-White
United Kingdom
00:31:36
02:56:45
01:23:15
04:58:13
F35-39
Ewelina Wolos
Poland
00:37:21
02:51:00
01:25:21
04:59:30
F40-44
Christine Verdonck
Belgium
00:31:59
02:48:21
01:32:48
04:59:30
F45-49
Corina Hengartner
Switzerland
00:32:09
02:47:28
01:26:52
04:52:35
F50-54
Sharon Schmidt-Mongrain
USA
00:35:32
03:08:55
01:27:47
05:20:34
F55-59
Michellie Jones
Australia
00:32:28
03:07:46
01:37:59
05:25:36
F60-64
Sophie Kerlaouezo
France
00:41:48
03:23:27
01:41:14
05:55:12
F65-69
Judy McNary
USA
00:38:28
03:28:39
01:54:58
06:11:37
F70-74
Alexandra Dronkers
Netherlands
00:43:10
03:59:16
02:22:52
07:17:28
And here are the men’s age group champions.
Division
Name
Country Represented
Swim
Bike
Run
Finish
M18-24
Samuel Studer
Switzerland
00:24:02
02:18:34
01:17:01
04:06:14
M25-29
Quentin Amaral
France
00:27:40
02:23:47
01:14:43
04:11:55
M30-34
Luke Tasker
Canada
00:25:26
02:23:07
01:14:04
04:08:18
M35-39
Lars Wichert
Germany
00:29:27
02:23:08
01:18:59
04:17:40
M40-44
Greg Van Avermaet
Belgium
00:31:02
02:16:08
01:21:30
04:15:56
M45-49
Donald Brooks
United Kingdom
00:26:26
02:29:48
01:17:23
04:18:57
M50-54
Paul Lunn
United Kingdom
00:30:58
02:33:07
01:22:38
04:33:05
M55-59
Lennie Kristensen
Denmark
00:34:11
02:32:40
01:27:04
04:41:41
M60-64
Adrian Santonastaso
Switzerland
00:33:07
02:41:18
01:30:59
04:51:59
M65-69
Eben Jones
USA
00:27:29
02:51:11
01:42:03
05:09:20
M70-74
Christos Garefis
Greece
00:31:46
03:09:28
01:59:06
05:48:23
M75-79
Guido Dona
Italy
00:39:15
03:25:59
02:17:51
06:34:43
M80-84
Albert Dulac
France
00:58:26
03:53:56
02:24:35
07:33:08
HC
Jan Tomanek
Czech Republic
00:37:48
04:33:06
01:41:50
07:02:50
The 2026 IRONMAN 70.3 World Championship will head to another difficult course, with Nice, France hosting that event as part of the switch back to a single day IRONMAN World Championship in Kona. Nice will also host the 2028 IRONMAN 70.3 World Championship. The 2027 race date and location are yet to be determined.
Thought it’d be interesting to see which athletes were ‘best of the best’, using the AG Div Kona Standard performance pool factors. Acknowledge that, for 70.3Q, M and W are in discrete performance pools. Note the M80 in the middle of the pack.
I think you are misunderstanding the coefficients from Kona when they are applied to a course with massive elevation. The coefficients are generated based on degradation on a course where watts per kilo are not super important.
Men inherently have higher watts per kilo than women. It’s just the way it is at the pointy end.
So if you apply the coefficients on a course that gives high watts per kilo people better performances, those with lower watts per kilo won’t get a good “assist” from the coefficient.
the assist from the coefficient will inherently help low watts per kilo people LESS on a hilly course, and this course was relatively unprecedented for total climbing, so when you apply the Kona coefficient to this race, you’ll see the results that @Ajax_Bay computed for us.
It’s not that the coefficients are wrong, as they will help low watts per kilo more on flat courses and will help them less on hilly courses.
I know you have an axe to grind on this, so just calling you out that you are just trying to see what you want to see, rather than understanding how this works out.
He applied the Kona coeffiecients to a half Ironman with a ton of elevation. It’s all irrelevant. If you want to see how younger and older guys stacked up to each other, a closer analysis would apply the half IM coefficients, because at least they were generated from two years of St. George, one year of Lahti, one year of Taupo and one year of Nice so they include three hilly courses and two rolling courses (but none of those courses were even inside 500m of vertical of Marbella).
And let’s not forget that 1.00 baseline in the half IM men’s side is 18-24
@Ajax_Bay can you just re run these based on the half IM coefficients and keep two different groups, one for men, one for women and don’t mix the genders? Just to see how different winners stacked up with their own genders with the half IM coefficients (this pitting genders against each other is just all around problematic). In the women’s field, all the age group winners under 49 were 4:52 to 4:58.
You missed something. Lucy would also get an assist because these are age x sex graded times. You would need to apply the 30-34 womens coefficient to Lucy’s time and Jelle would get no assist as he is in the 1.00 coefficient age group for KonaQ
We have to keep in mind that this race was not a “normal” men/women final time distribution. When you look at the pro times, the mens race was much faster than the womens, mostly from the factors dev pointed out. On a flat course we often see the differential in the 20+ minute range. This race was in the 30+ range. And besides the obvious difficult bike times, for some reason the swim times were off too. So either they moved the buoys, womens negative current was worse, or the men just out swam their normal times. But I find that one harder to believe, as Lucy was in the race and she drilled it hard enough to shake all cling ons, but her delta was 3 minutes or so from the lead man. Who incidentally was just a tiny off the front, losing all of it in transition to the actual huge lead mens group. And the run times were also off, likely due to the harder bike too perhaps? 10 minutes from lead man to lead woman is on the high end of the usual delta. Typically if you got guys running 1;07’s, there is a woman running sub 1;15 in these super stacked fields…
Dev - I actually did this at first and then realised that this would not compare all the AG divs on the same basis, and edited my post with the factored times by Kona Standard. Here are the separated lists, using the 70.3 factors. Edit: Comparing men and women in the two tables below is entirely flawed - for that go to my first table ^^^. That’s why the list below is sorted all W then all M.
Hengartner must have an ‘interesting’ history.
Division
Name
Time
70.3Q Factor
F45-49
Corina Hengartner
04:52:35
04:28:57
F40-44
Christine Verdonck
04:59:30
04:42:19
F55-59
Michellie Jones
05:25:36
04:44:46
F65-69
Judy McNary
06:11:37
04:48:56
F50-54
Sharon Schmidt-Mongrain
05:20:34
04:49:01
F35-39
Ewelina Wolos
04:59:30
04:49:15
F18-24
Juliette Lucet
04:55:22
04:53:02
F30-34
Natasha Harris-White
04:58:13
04:53:05
F25-29
Larissa Jasper
04:54:15
04:54:15
F60-64
Sophie Kerlaouezo
05:55:12
04:58:03
F70-74
Alexandra Dronkers
07:17:28
05:21:27
Division
Name
Time
70.3Q Factor
M80-84
Albert Dulac
07:33:08
03:50:52
M45-49
Donald Brooks
04:18:57
03:52:29
M65-69
Eben Jones
05:09:20
03:56:20
M40-44
Greg Van Avermaet
04:15:56
03:57:03
M60-64
Adrian Santonastaso
04:51:59
03:59:12
M30-34
Luke Tasker
04:08:18
03:59:44
M50-54
Paul Lunn
04:33:05
04:01:13
M55-59
Lennie Kristensen
04:41:41
04:01:16
M35-39
Lars Wichert
04:17:40
04:04:47
M18-24
Samuel Studer
04:06:14
04:06:14
M70-74
Christos Garefis
05:48:23
04:08:01
M25-29
Quentin Amaral
04:11:55
04:10:08
M75-79
Guido Dona
06:34:43
04:13:22
And for those who think it useful, here are the Pro winners, age factored. I’d normally expect a differential in the MPro/WPro to be circa 24 minutes (last 5 years: 25, 21, 26, 23, 30 - Nice last one with climb). This year it was 32 minutes. This is partly because the race winning times were longer, but even on a % view, Marbella and Nice were outliers.
“men 45+ are all better then M45” Have no idea where you get the first bit from: young Studer comes out as second best man. Brooks (M45) sits in the middle of the pack.
And no, you can’t compare across the sexes in that second list: the first list gives a better picture for the comparison you seek to make. In my first table M65 Jones tops it at 3:53 and LCB’s factored time is ~3:48. Jones clearly a phenomenon or just had an amazing race, most likely both.
@monty offers some excellent context/points, but on this one, we were deprived of the top WPro runner hitting sub-1:15 and giving us a much closer finish. Think LCB would’ve still won as I can’t see Matthews (whose gap was >3:20 to LCB leaving T2) running sub 1:14 last Saturday even with both legs functioning. LCB’s run was about a minute faster than her previous best half (a full 21.2km).
Thanks for doing the adjustments applying the half IM Coefficients race by race (separating genders).
Now what we will see in the factors that get adjusted in July 2026, is that Marbella gets added in and Nice 2019 gets dropped out. The coefficients will then help the older age groups EVEN more on flatter courses.
At a personal comparison my race time in Marbella was 21 minutes slower. My qualifer race for next year done in June had 1050m of vertical on the bike and 220m on the run. In Marbella, the race had 1550m vertical on bike and only around 120m on the run. I was 23min slower in my bike but I was 11 min faster on the run (my qualifier race was around 12C hotter than Marbella and way more humid). For comparison, my finish time 5:58 which got me 83 in M60-64 was 0.687 of Samuel Studer (4;06) in M18-24. This is even further off than my age grading coefficient of 0.82. The 37th place guy in my age group (20th percent guy), was 5:34 (as it turns out him and I had essentially the same swim and I were in T2 at the same time, he just runs 20 min faster), he was at 0.737 of the winning time. Our current age group coefficient is 0.82. The winner in our age group however was 246/291 = 0.82 away from the winner and I do realize we need to take the average of the top 20 percent in 20-24, and not just the winner, and the 20th percentage point guy in that age group was 4;36, so somewhere between 4:06 and 4:36 in the 1.00 average and eyeballing it the 1.00 benchmark average time is probably more like 4:26, in which case my time ends up 0.745 behind the rough average 1.00 score. It’s still a lot worse than the coeffficient being used today.
So I think when Marbella enters the coefficient calculation and displaces Nice it helps older athletes EVEN more than the Nice 2019 course did. Nice had a less difficult bike and a totally flat run.
If I was Ironman, I would exclude Marbella from the factor adjustment as it is really not that reflective of any course we have in the entire IM circuit if you apply a factor weighted 1/5th by Marbella to every qualifier race (other than Marbella)
No offense to you at all, but just reading your post with all these AG coefficients scattered throughout reveals how dumb this qualification system is.
Someone at Ironman was sold on a magical bag of beans that turns out to be just full of gas.
It’s not dissimilar to how the golf handicap system falls apart with either bad data input (incorrect scores) or if a course rating / slope isn’t appropriately calculated.
Example: my old home course back east had a significantly higher rating and slope for the standard men’s tees as opposed to the new one here in Oregon. So if I shot 82 back east, it roughs out to me being around an 8 handicap. Doing so here means I’m closer to a 10. So in matches, at the moment, I’m giving up a couple bonus strokes that I could probably use against guys who are scratch or better. I’ve been buying a lot of beers…
In fewer words: the coefficient math calculus is simply off base. They got their scoring factors wrong. And people will vote with their wallets. (by most likely pivoting to running, gravel, or Hyrox.)