I just got a Powertap and Garmin 705. I’m trying to decide which software to use. I have a Mac and it looks like the two most popular programs are Raceday and Golden Cheetah (any others?). Could current users explain what they like/don’t like please. And if anyone has experience with both, a comparison would be great. Also, if people think Training Peaks WKO+ is superior to both, that would be interesting to hear as well - as I could always run parallels, but would prefer to run something natively on the Mac. Thanks.
I’ve never used RaceDay, but Golden Cheetah works really well. I’m also on a mac, and I’m kind of split between Golden Cheetah and the stock Power Agent. Golden Cheetah has more info, and organizes it a lot better than Power Agent. More graphs = win.
Although I am not a Mac user, I have used raceday and wko but not the cheetah. I will say after reading coggin’s and allen’s book, wko was a much more appropriate analyzing tool than raceday. But they are different in some aspects. Raceday claims to be a performance predictor, and I like the way you can put in test workouts to come up with this prediction and see a move in your CP automatically. Wko is similar with its performance manager chart. Wko’s charts and graphs seemed a touch more helpful for me than raceday’s, but I haven’t used raceday as much so can’t give it a real objective ruling. I’m also partial to wko because I have a trainingpeaks account and it works seamlessly with it. but overall, I do like wko after I did my homework.
After skimming through golden cheetah’s site, it looks a lot like what raceday has to offer. I will say that raceday has excellent customer service from the creator himself with very timely feedback replies that are very helpful. You can also try raceday for 2 weeks free. I believe you can do the same with wko but will have put down a cc number and cancel it. Good luck.
Do either/both do normalized power?
Do either/both do normalized power?
They use Skiba’s “BikeScore” which has a similar basis (though the exact algorithm is different). Of course, if you want NP, you can just use excel.
yes, they are just called different names. They come out to be about a 1/10 different between wko and raceday.
Disclaimer: I’m the guy responsible for RaceDay, so I am a little biased ![]()
Golden Cheetah is a great program. I donated some of my algorithms to the cause, because I believe there should be a good open-source solution on the market. It is very good at showing you what you have done. It also does pedal force / velocity analysis (some call this “quadrant analysis”) which can be very useful if you know what you are doing with the data. I like GC and I like the guys who write it. If you have any programming talent, consider joining the cause.
RaceDay is a different animal. It will show you what you have done, but it will also show you what you should be able to do in the future. Basically, it looks at your training, looks at tests you do, and then uses calculus to describe how your levels of fitness and fatigue come and go, in order to predict your performance capacity on any given day. (Really, “fitness” and “fatigue” are better termed the “positive and negative effects of training”.) For instance:
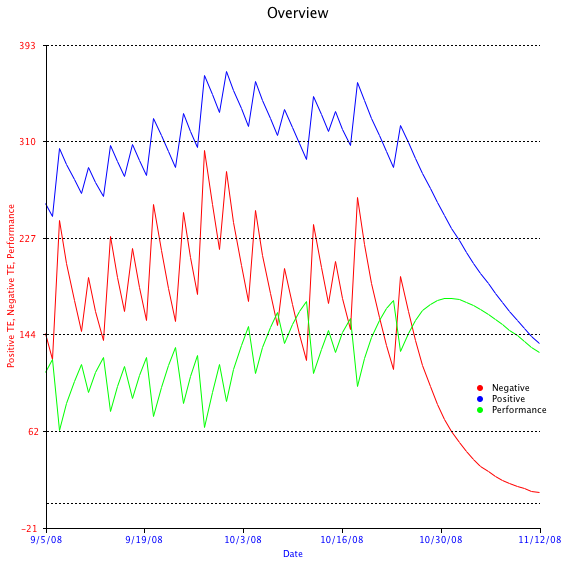
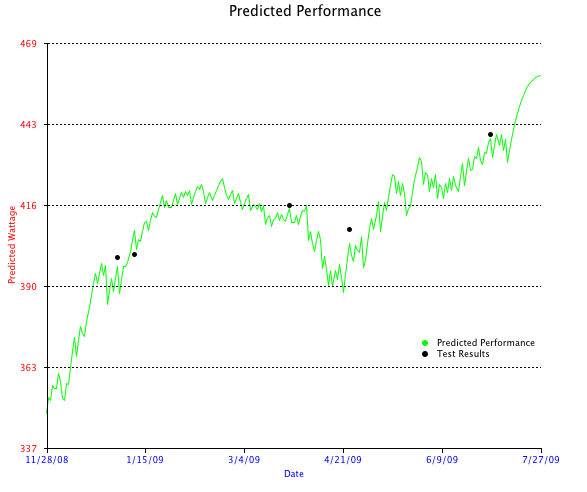
This graph gives you an idea of your relative levels of fitness, fatigue, and performance capacity, which may not be particularly exciting to you. What is much sexier, though, is the predicted performance graph.
As you can see, the software can do a very good job of telling you exactly how many watts / what pace or velocity you ought to be able to generate on any given day.
Based on the above, you can learn very interesting things. For instance, it will show you what training days are most important before a race, and exactly how and when you need to taper. See below…
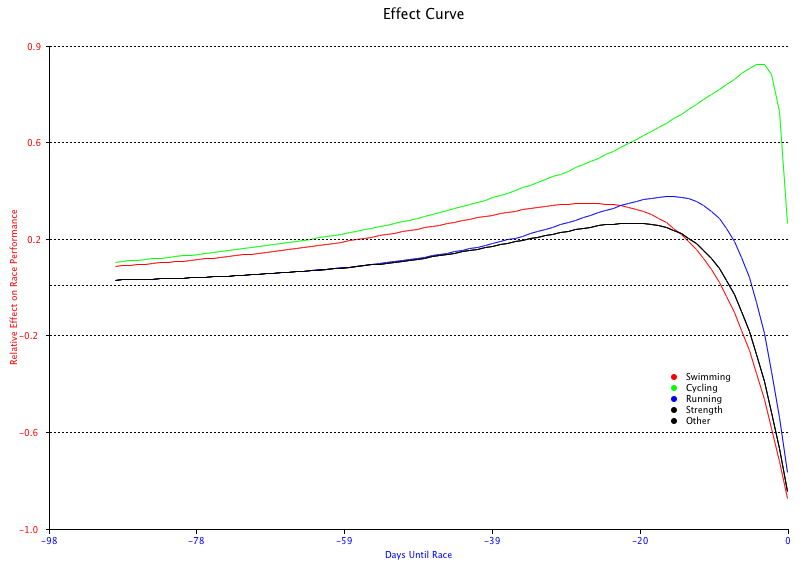
Basically, the high points of the curve indicates the time when it you should peak your training, and the day when it crosses the 0 line on the y axis tells you when additional heavy training will cause you to do worse, not better, on race day. In other words, it shows you how to build and taper for each sport. NB: Your optimal build and taper is likely different for each sport, and is rarely the same between 2 people. (Note to current RaceDay users: that Effect Curve graph above is a bit different from anything you have seen, since it tracks all sports at once. It comes from the next version of the software, due out soon ![]() ).
).
As you can see, unlike other products on the market, RaceDay automatically customizes itself to your physiology. There is no guesswork involved. You don’t have to eyeball things, or pluck time constants out of the air. What you see here is one of the reasons why our athletes do as well as they do.
Phil
The main difference between the algorithms is that while normalized power uses a 30s moving average to smooth the data, BikeScore uses a 25s exponentially weighted moving average to smooth the data. In most cases, they fall within a couple of watts of each other if given the same data.
Phil
Do either/both do normalized power?
They use Skiba’s “BikeScore” which has a similar basis (though the exact algorithm is different). Of course, if you want NP, you can just use excel.
Can you send me a copy of the spreadsheet? Or the algorithm that is used?
Do either/both do normalized power?
They use Skiba’s “BikeScore” which has a similar basis (though the exact algorithm is different). Of course, if you want NP, you can just use excel.
Can you send me a copy of the spreadsheet? Or the algorithm that is used?
Normalized power - there’s a sheet at http://www.cyclecoach.com/index.php?option=com_content&view=article&id=97&Itemid=118
- Or if power is in one column, make a new column with =average(cellA:cellB)^4 where cellA and cellB cover 30 seconds
- make another column with =average($cell1:cellB)^.25 where cell1 is the first point in the file and cellB is the same as above
- copy/paste for the length of the power data and voila, at the end is the NP for the ride
Note that by taking =average(cellX:cellY)^.25 you can get NP for different durations.
Phil–thanks for the info. Your software seems geared toward triathletes but I’m not seeing a lot of running/swimming info. Does your software allow entry of runs and swims too?
I’m a long-time WKO+ user on the bike but it’s frustrating to use as a triathlete…
Phil–thanks for the info. Your software seems geared toward triathletes but I’m not seeing a lot of running/swimming info. Does your software allow entry of runs and swims too?
I’m a long-time WKO+ user on the bike but it’s frustrating to use as a triathlete…
RaceDay is geared towards triathletes, and was built from the ground up with triathletes in mind. RaceDay allows you to handle your swimming and running data quite quickly and easily.
For instance, for swimming, you just enter the data the way you did your workout.
At the top, you just enter the data for the “threshold test” you do a few times a season. I usually have my high level athletes swim a 3k or something like that. You can also calculate critical pace and use that, or your iron-distance pace, or whatever. You just need to be in the ballpark. 100 SwimScore points = your threshold test distance in the time you can do it.
Then, you enter your workout…distance, time, reps. Done deal. RaceDay calculates average pace and xPace, which you can think of as a “normalized” pace. In other words, it tells you how the workout felt to you after taking into account work and rest intervals. It even calculates watts for you given Toussaint’s equations. (And yes, the effective power delivered to the water really is that low…most of your effort goes into moving water around, and not forward propulsion. Very depressing ![]() ). It also lets you graph the workouts, etc.
). It also lets you graph the workouts, etc.
For running, you have a couple of choices. You can feed it your GPS or Polar files, or connect your Garmin and download. (It will talk to your Garmin directly…still working on polar). It will then use GOVSS to calculate your training stress, power output, etc.
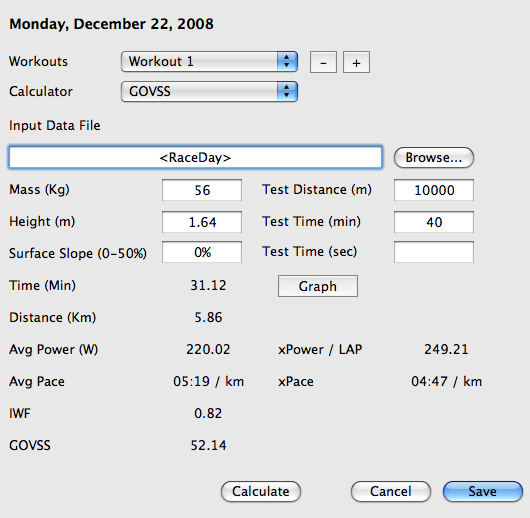
Again, you enter the threshold test and time you want to use. The new version of RD will do this just a bit more slickly…but that is still top secret :-). Don’t have a GPS, no problem. You can use RunScore.
You can enter splits from a track workout, or treadmill workout, or whatever. Works great.
The rest of the program works exactly the same way…you can model your fitness and predict your performance in both swimming and running with alarming accuracy. (It shows watts on the axis, but if you float your cursor over the line, it gives you predicted pace, etc)
The forthcoming version (still under wraps, although it is being tested now), allows you to enter your strength training, plyometrics, etc as well. It also has a whole suite of new functionality not before seen in a desktop program, and previously only available for our internal use / the use of certain elite training centers, university and professional teams, etc.
One other thing that users really like is the export function. Let’s say I’m your coach, and you want to send me your workouts. Piece of cake. Tell it what date range you want to send, and it generates a single file that contains all your data for that time period. Email me the file, I can import with a single mouse click. Done deal.
Phil
It also does pedal force / velocity analysis (some call this “quadrant analysis”)
Such as the inventor.
Dr. Skiba,
How did you get the effect curve for each sport in the same graph? Is there a way I can do this or did you just overlay them on top of each other in creating the chart?
Thanks, Rob
is there a way to get raceday to use yards, feet, pounds, etc instead of metric units?
That picture comes from the new version, which treats all the sports for one athlete together. It is still a private alpha version, but we will be announcing details soon ![]()
Phil
Another feature in the forthcoming version. You’ll be able to choose units by sport. (We initially built metric because this was the preference of the scientists / training centers who were using it before it was publicly available).
Phil
it will show you what training days are most important before a race, and exactly how and when you need to taper. See below…
Strange that the effect curve for swimming implies significantly different time constants for that sport vs. cycling. That’s not consistent with the scientific literature on the model (i.e., Banister’s) you have implemented, is it?
Strange that the effect curve for swimming implies significantly different time constants for that sport vs. cycling. That’s not consistent with the scientific literature on the model (i.e., Banister’s) you have implemented, is it?
That is really one of the surprising things I have found (or, perhaps not that surprising given the homogeneity of the athlete populations studied in the literature). When you look at real world amateur athletes, i.e. people who have limited training time, people who cannot always be as consistent as they would like etc, you end up with models that can be quite a bit different than what you’d expect given the literature. I think this shows the real importance of this type of analysis.