It’s been well established by both Mavic (link) and Flo (link and link) and Trek (link) that yaw probability calculations should be used instead of straight averages of the drag across the sweep. Both of these companies are thought leaders in this space, both used a similar methodology, including testing on the same course (Kona) – yet frankly, the results don’t agree that much. Some firms use the Mavic data for the weighting because it is strongly biased towards high yaw (Kona) compared to the Flo data, which is much more concentrated at low yaw. Flo says 70% of the time spent riding happens between -5 and 5, while Mavic says that figure is less than 40%. You see the challenge. This is the type of difference that could change the order of some of these bicycles from a ranking perspective, so I want to tread carefully here in using this very important input.
I think for simplicity the goal should be to come up with a ponderation law or ponderance curve, which is Mavic’s pretentious term for “probability” or “histogram” or “distribution”. Flo uses a description: percentage of time spent in yaw angle range. Trek uses something similar except that they bifurcated their research by probability data collected on two different IRONMAN course – Kona and Wisconsin – which is presented in a simple histogram with time on the y axis. Can you see who directed their report at consumers and who didn’t. Anyways, they are saying the same thing just differently. We need to come up with a cumulative density function, effectively, on which to calculate "weighted average drag " or “net drag reduction value”, Mavic and Flo’s terms, respectively. These are very simple calculations once you have the histogram and make an assumption about what to do beyond -10 and 10 with your discrete data points from those angles, given the reality that we don’t know what happens at high yaw in terms of stalls and the like.
If TinyPic weren’t broken I’d paste some charts, but here are the links.
Ponderation law (Mavic): link
Global results law (Mavic): link
Kona ponderation law (Mavic): link
Flo percentage of time at yaw angle range link
Trek probability (page 11, which you’ll have to count to because they don’t have page numbers – shaking my head): link
This exercise is for you. What makes you most comfortable? Where do your biases lie – toward the research that points to low you concentration or high yaw concentration?
Finally, I don’t actually have any of this raw data except from Flo. I can’t look at a bar chart pic and convert it into a spreadsheet. So if anyone is willing to provide the Mavic data raw, I would be grateful.
“Ponderation” is just a transliteration from French. It’s just a weighting function, or basically the histogram of the yaw experienced. (In French, a weighting function is “fonction de ponderation”.
“Ponderation” is just a transliteration from French. It’s just a weighting function, or basically the histogram of the yaw experienced. (In French, a weighting function is “fonction de ponderation”.
My mind is not so brilliant, but I’ll answer anyway…
I’ve used the Mavic weighting for my combined aero+Crr calculations…but mostly because that’s all there was when I started doing it. I can send you the “binning” values I’ve used later.
I think I’d just average the Mavic (ponderation) and the Flo weightings and call it a day.
BTW, download the freeware “Engauge Digitizer” to grab (digitize) data points off of plots
I buy what I can afford, considering how it looks first and how aero it is second. After that I simply ride my bike based on how I feel and what my power meter says and I don’t worry about any of the aero shit at all.
I’m an Applied Mathematics major that works as an engineer, so I’ve come to understand that numbers don’t lie, but people how publish them often do, and life is too short to worry about who is lying to me about CDa.
I’m on the same page as Tom A. Just by looking at a couple of datapoints, the Mavic and Flo curves appear to mostly envelope the others. So, the AZ and HI curves might allow a design to be optimized to either specific locale…I don’t think that what I want as a consumer. I want a bike that is as good as can be in as many different situations as possible.
The AZ and HI curves might allow you to say “this bike is best for Kona” and this bike is best for IMAZ. But, who buys specific bikes for specific events? Not me. Maybe if you give me flight controls that allow me to configure the vanes optimally…no, I’m can’t afford these bikes, let alone an articulated version.
Not claiming any brilliance but I can think of one element that can HIGHLY confound the data collection. If I recall correctly, mavic mounted some or all of their instrumentation on the fork. And I think some of the other parties might have mounted some or all of their equipment on the frame, but with the instrumentation still located well ahead of the bike (so still in clean air).
Because even if the environmental conditions are identical, even the rider takes an identical path at an identical speed, and even if the instrumentation is set up in exactly the same place in space in clean air, just the change of fork vs frame mounting will give hugely different yaw data. When I saw that mavic did this, I wondered why in the world they would do this, especially if the point is to evaluate the whole bike + rider system …
Yaw depends not only on the wind speed and its direction but also on your speed, so even on the same course with the same wind a slow rider and a fast rider will see different yaw distributions. So if you really care about such things (and not everyone does) it’s better to see the entire drag vs. yaw relationship than to reduce it down to one summary statistic, even if that summary statistic is based on a standardized weighting function.
Interesing (or ODD). I wondered that very thing when I first saw the Trek setup–which I thought invalidated the whole data set. The pictures are kind of grainy, but I’ve convinced myself that it is somehow mounted to the head-tubes on the various test bikes and not connected to the steerer/fork (ie, articulated with the front wheel, as you described the Mavic config).
We’ve always done frame mounted, in such a way as to put the business end of the sensor on the centerline of the frame and far out enough to be in clean air, as DSW noted.
Yaw depends not only on the wind speed and its direction but also on your speed, so even on the same course with the same wind a slow rider and a fast rider will see different yaw distributions. So if you really care about such things (and not everyone does) it’s better to see the entire drag vs. yaw relationship than to reduce it down to one summary statistic, even if that summary statistic is based on a standardized weighting function.
Yeah, I planned to integrate this into the model as well. But that’s not the purpose of this thread.
Quantifying that metric is important because nobody seems to do it. There’s this general understanding “if i’m slow high yaw is more important whereas if I’m fast low yaw is more important”. But nobody does a very good job of framing those differences with maths. Maybe you’re the guy to help do that?
I have the mavic data digitised, happy to share. I used it to validate and improve the modelling I’ve been doing for a long time.
I don’t consider it worthwhile to try to isolate one curve that is representative, consider how different this modelled distribution for a particular ride in Florida is to the Kona data.
Most people are trying to qualify for Kona in far narrower yaw distributions than they will encounter on race day.
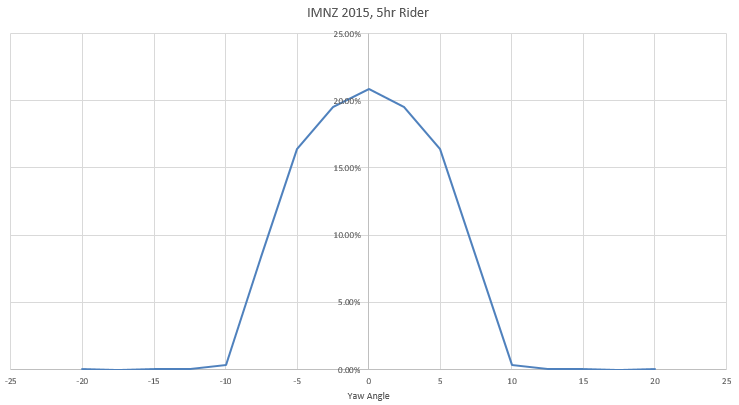
Two different years of IMNZ
Yaw depends not only on the wind speed and its direction but also on your speed, so even on the same course with the same wind a slow rider and a fast rider will see different yaw distributions. So if you really care about such things (and not everyone does) it’s better to see the entire drag vs. yaw relationship than to reduce it down to one summary statistic, even if that summary statistic is based on a standardized weighting function.
But a summary statistic is nice because it’s hard (even for people who care and have some familiarity with such things) to look at a series of drag vs. yaw plots and decide which one would be optimal for a specific person at a specific type of conditions. You can ballpark, particularly for extreme conditions (if very low wind and you’re fast, it’s an easy call).
It might be nice to have a kind of heat map. Where, say, the x-axis is your expected average speed and the y-axis is a sort of ponderation index (in some order of monotonically increasing yaw). The heat values would be the NDRV numbers for a particular piece of equipment. Then you could identify the sweet spots pretty easily.
Yaw depends not only on the wind speed and its direction but also on your speed, so even on the same course with the same wind a slow rider and a fast rider will see different yaw distributions. So if you really care about such things (and not everyone does) it’s better to see the entire drag vs. yaw relationship than to reduce it down to one summary statistic, even if that summary statistic is based on a standardized weighting function.
Yeah, I planned to integrate this into the model as well. But that’s not the purpose of this thread.
Quantifying that metric is important because nobody seems to do it. There’s this general understanding “if i’m slow high yaw is more important whereas if I’m fast low yaw is more important”. But nobody does a very good job of framing those differences with maths. Maybe you’re the guy to help do that?
That ‘metric’ isn’t…
The yaw angle distribution is meaningless without three other measurements and can’t be applied without three (or more) rider properties. That’s why nobody ‘does it’.
If you’re only going to report one number, I would lean toward using something that emphasizes low yaw – so Flo I guess. High yaw effects are specialized and can be large. I would never choose a bike because of its high yaw performance, yet using the Mavic weighting will result in that.
Another option would be to report two numbers: a low yaw weighting and a high yaw weighting. The Mavic seems good for the high yaw one. For the low yaw one I’d use something even narrower than Flo, that puts weight only on -5 to 5.
The yaw angle distribution is meaningless without three other measurements and can’t be applied without three (or more) rider properties. That’s why nobody ‘does it’.
Yeah, I know this. But I think that’s garbage. Very simple for a company to provide an excel file with dynamic inputs so the customer can contextualize the data for them. The maths aren’t that difficult. Talking about it is, unless you stipulate, like cyclenutz has in his data, that these figures apply to a 5 hour rider who has x, y, and z.
You can’t have it both ways, coming here asking for help with the ‘yaw thing’ in your ‘model’, and then refute my hint that it’s very much more complicated than a distribution weighting with “the maths aren’t that difficult”.
…
I think for simplicity the goal should be to come up with a ponderation law or ponderance curve, which is Mavic’s pretentious term for “probability” or “histogram” or “distribution”. Flo uses a description: percentage of time spent in yaw angle range. Trek uses something similar except that they bifurcated their research by probability data collected on two different IRONMAN course – Kona and Wisconsin – which is presented in a simple histogram with time on the y axis.
…
Trek doesn’t use a simple distribution weighting formula.
Note that these simulations take into account the key subtlety that not all time at a given yaw angle is the same. For example, a 5° yaw angle can occur in a wide range of conditions — headwinds, tailwinds, fast descents, slow climbs, etc. So, it is important to also consider the apparent airspeed and bike speed for each time segment at a given yaw angle. This allows us to more appropriately analyze the bike’s true aero energy consumption and time savings at all moments during the ride.
They have all the data required to do this and they indicate how non-trivial it is to properly quantify what’s ‘fastest’.
Mavic and Flo might have all the data but they don’t (?) indicate that they use it properly, they do however give you some ‘yaw angle distribution’ which you seemingly want to run with…
RChung told you what to do. Just present the drag coefficient vs yaw angle. Corrected for beta-squared of course…