I have been trying to increase my knowledge on bike aero tech, and one issue that has been hard to get good info on (beyond a mention in passing) is stalling with aero wheels and frames.
Just as aero wheels and frames can sail, at high enough wind speed and angle/yaw, air flow should detatch, and they should eventually stall. Life experience says that air can eventually reattach and sail in a “push†from behind. I presume the aero shapes increase this push via sail effect again.
I am i am just trying to sort out when/if aero shapes on bikes can work against the rider in a stall effect.
Maybe i just need to run the math and add the vectors for changing wind direction to get a full understanding. May e the answer has been infront of me the entire time, and stalling is air detatchment, and aero shapes delay that event as long as possible by keeping the airflow attached.
I think what i am trying to sort in my head, is: at a specific bike speed, with a constant wind velocity and direction, with a bike going in a large square (for example), at what yaw angles does the airfoil frame/wheels help, and when does it hinder (ignoring cross wind instability). I.e. what are the net force vectors.
My problem is that i seem to read the words, but i need to run the numbers to understand. The hed yaw calculator site seems to be down, or not compatable with my browsers.
Thanks for the links above. I think i need to start at first principles.
I hope i am asking this question correctly. In gathering that data, was the wind tunnel set at 20 or 30mph and then the bike/rider rotated, with grams of drag being calculated at each angle?
I guess what i am trying to visualize is a data that would be something like this:
Rider on bike putting out say 300w. Baseline zero km/hr wind. Lets say that rider speed at 300w is 40km/hr. Lets say that the grams of drag on the bike and rider is 400 grams at 40km/hr with no wind.
Now lets add a headwind of 30km/hr (net headwind now 70km/hr). Lets say the grams of drag are now 700g. Now with the rider sustaining a 300w output, what is the net grams of drag as the wind direction (still 30km/hr) rotates through 180degrees.
The above makes more sense to me because it does not assume the net wind vector is the same speed (20 or 30mph) despite changing wind direction. But it would be easy to maintain constant wattage.
To take it further, it would be nice to calculate the grams of drag at different wind angles, and get the equivalent wattage gains or losses, or net speed gains or losses of the bike/rider.
To me that would replicate a real world scenario, assuming your ride is a loop (i.e sometime wind is headwind, sometimes tailwind, sometimes in between). I would then like to see at what angles of wind the aero bike/wheels “stall  and when the wind direction starts to “push†again.
My goal would be to compare the benefits of deep vs say box section winds to truly compare the advantages/disadvantages.
I dont think my model exists, because it is too complicated. Unless i misunderstand how wind tunnel generated graphs like yours are calculated.
Air on the leeward side will only reattach if the bike and/or wheel velocity decreases after the air detaches. Of course more tube and chord depth in the frame tubes and wheel rims will move the point (or bike speed) at which the air detaches to a higher speed - which is desirable, when riding with a cross wind. But going head on into the wind or almost, the bike speed will be a little slower with higher chord depths. And that ain’t desirable.
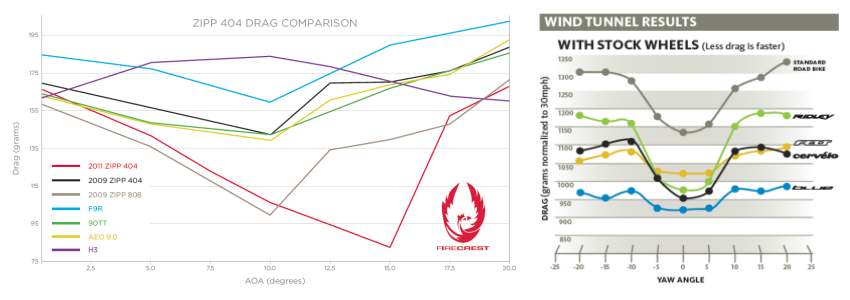
Most tunnel testing is done at 30 mph. Not that most athletes ride at that speed but to exaggerate the numbers enough to show differences more easily in bikes, set-ups, hydration ad on’s, etc.
There are bike companies and wheel companies that do all kinds of testing and publish information that they choose to publish out to 25 degrees (at 30 mph).
By doing a side-by side test at 20 mph we just wanted to answer a question that was being asked.
The chart above simply shows that - outside of about 7 degrees of yaw and at a speed (20 mph), a speed that many athletes average in a triathlon - well, you can see the results. And, you can see those results compared to 30 mph (which companies have used to sell a lot of product).
Note: generally for rider on testing one would use a much lower watt output so the rider can pedal very consistently over many many runs sometimes most of the day). A pace that they can hold, not move much on the bike but where we can still have usable data from the body, head and leg rotation.
So with the above 2011 Zipp 404 wheels as an example, they stall quite aggressively once you surpass 15 degrees yaw. Or with the standard road bike, a bike velocity of 40km/hr with a wind velocity of 50km/hr at a wind angle of 179 degrees (strong tailwind) is a yaw angle of -5 degrees (~1175g at -5 degrees vs ~1140g at 0 degrees yaw for a net gain of 35g “push” from the effective tailwind of 10km/hr).
I agree that 20mph shows little aero differences, but that is where environmental wind speed can factor in. The guy riding 20mph with no environmental wind will have an effective windspeed of 30mph if he is biking into a 10mph wind. Then the aero gains of his bike may pay dividends, even if his overall wattage only allowed 20mph in a zero wind scenario.
It’s really interesting to see the difference in yaw where the bike stalls at different speeds.
With all the discussion about what distributions of yaw angle (and at what frequency) do cyclists really experience and what bikes do well at low vs. high yaw based on 30mph tunnel tests, there really seems to be a mismatch in the info available to make an informed choice.
I think I see your thinking, but it won’t work out in reality. Put simply you’re still moving forwards through the air, just with a higher ground speed because you’re pedalling. Imagine sitting up with a tailwind while putting in the same power, you’d have more drag and go slower, though the effect is reduced compared to still conditions.
If it’s so windy that your airspeed is negative with a tailwind and higher drag makes you faster (ie actually being pushed along) , I’m in the cafe.
I was going to try and answer your question, but then I couldn’t figure out quite what it was.
I think you need to try and re-state it more clearly. As much for yourself as for anyone else.
Much of the time, trying to clearly define the question is half the battle.
Besides the rather convoluted description there is some stuff that appears to be contradictory and I can’t figure out whjat’s intended. For example power required, speed and drag are directly related to each other but you seem to be assuming all three and asking for the impact of wind. I don’t understand that.
Also you’re saying the wind vector stay the same but the wind direction changes. A vector is a magnitude and a direction. You can’t both keep a vector the same and change it’s direction.
The question is muddled. I think you would find it useful to break your query down into simpler pieces.
Also, it seems you’re suggesting doing simple maths to determine the angle of attack at different points around a course assuming a square route with a fixed bike speed and wind speed. While that can be done easily enough, there’s a problem with applicability in my opinion.
Windspeed close to the ground is not constant. The ground has a boundary layer and it’s thick. It will be obvious that wind effect is greatly altered by shelter such as mountains, buildings, trees, hedgerows, walls, etc. What seems to be less understood is that there is a wind gradient as you move vertically from the ground to altitude even on a wide open plane. this is the ground’s boundary layer. The bottom of your wheels experiences zero wind (and zero forward motion but lets ignore that for now), so effect of wind at that point is zero. The top of your head will experience the highest windspeed. And everywhere in between will be somewhere in between. You can’t interpolate linearly, the gradient is not linear. i.e. a point halfway from the ground to your head can’t be expected to experience half the windspeed.
So, as you change the wind direction, not only will different parts of yourself and your bike experience different windspeeds, but the impinging airflow will vary in both magnitude AND direction (i.e. the airflow vector changes as distance from the ground increases from road level to top of the rider’s head).
I don’t think this is taken into account in most wind tunnel modelling. I know some studies have been done as to the most common yaw angles experienced by cyclists but I think they’ve picked a height for their probe and assumed it’s representative of the entire bike. I may be wrong. I’ve never looked at the test rigs and protocols so I must be fair and allow that this may have been considered and catered for. However, Since tunnel testing consists of turning a bike in a fixed direction flow, whether with or without representative ground boundary layer modeling, it’s not going to be truely representative of conditions on the road.
In short(ish), for various reasons I don’t think it’s feasible to do some simple maths to determine angle of attack around a course for an assumed fixed windspeed and come up with simple figures to plug into a wind tunnel test plot and determine a drag figure and thus determine optimum bike design type.
so here is my next question: Would a standard round tube bike (and or with box rims) benefit more than an aero bike from tailwinds?
Think about “relative” wind, which is the wind perceived by the rider.
If you ride 20 mph with no wind, relative wind is 20 mph from the front
If you ride 20 mph with 10 mph front wind, relative wind is 30 mph from the front (bad luck)
If you ride 20 mph with 10 mph tail wind, relative wind is 10 mph from the front (lucky guy)
If you ride 20 mph with 30 mph tail wind, relative wind is 10 mph tailwind (lazy guy)
…
If relative wind is from the front (3 first examples above), the more aero (bike + rider), the less drag, so less power needed for same speed.
If relative wind is from behind (4th case, never happen), the wind is pushing you. The less aero you are (from behind) the more push you will have. Unfortunately, this case barely happen (to my grandmother, may be).
…Rider on bike putting out say 300w. Baseline zero km/hr wind. Lets say that rider speed at 300w is 40km/hr. Lets say that the grams of drag on the bike and rider is 400 grams at 40km/hr with no wind.
Now lets add a headwind of 30km/hr (net headwind now 70km/hr). Lets say the grams of drag are now 700g. Now with the rider sustaining a 300w output, what is the net grams of drag as the wind direction (still 30km/hr) rotates through 180degrees
Just to demonstrate what I said previously about speed, drag and power being directly related. For the quote above:
1. At 40km/h with 400g drag
Velocity = 11.11m/s
Drag = 3.92N
Power requirement to overcome drag = 11.11*3.92 = 43.6W
So you’re allowing 300W to do 43.6W of aerodynamic work. I really doubt your rolling resistance is 256.4W!!!
However you also won’t manage 40km/h on 43.6W+ RR. In fact the issue is your drag figure is way off.
Power requirement to overcome drag = 11.11*6.87 = 76.3W
Now you’re allowing 300W to do 76.3W of aerodynamic work. The rolling resistance is pretty unchanged (same ground speed though contact forces may be changed slightly due aerodynamics).
Power needed should not remain unchanged if groundspeed remains constant and airspeed increases.
The aerodynamic drag figure here is even further out.
You seem to have assumed that drag increases linearly with airspeed (400g for 40km/h and 700g for 70km/h). This is very much mistaken. All else being equal aerodynamic drag will increase with the square of the airspeed (and thus power required to overcome aerodynamic drag will increase with the cube of the speed in still air). I know you were probably just assigning figures for the sake of an example, but your sense of proportional impact of the different factors could be thrown way off if the figures, and their relationships are massively out.
**Note: **Grams are not actually a legitimate measure of drag, but it is used routinely in bike aerodynamics, which is very silly IMO. Grams are a measure of mass, drag is a force. They are only related via gravity and it’s wrong to treat mass like weight. In the calculation above I have converted grams to Newtons by multiplying by the acceleration due to gravity at sea level on earth which is the only reasonable way to use it.
I think I see your thinking, but it won’t work out in reality. Put simply you’re still moving forwards through the air, just with a higher ground speed because you’re pedalling. Imagine sitting up with a tailwind while putting in the same power, you’d have more drag and go slower, though the effect is reduced compared to still conditions.
If it’s so windy that your airspeed is negative with a tailwind and higher drag makes you faster (ie actually being pushed along) , I’m in the cafe.
I thought of the scenario as i reciently rode my road bike into 50km/hr winds (gusting to 80), and then rode home with the wind at my back. It really did feel like i was sailing and as if there was almost no wind. I made good time on the ride home. I don’t drink coffee.
I was going to try and answer your question, but then I couldn’t figure out quite what it was.
In short(ish), for various reasons I don’t think it’s feasible to do some simple maths to determine angle of attack around a course for an assumed fixed windspeed and come up with simple figures to plug into a wind tunnel test plot and determine a drag figure and thus determine optimum bike design type.
Agreed, speaking the proper language is half the battle.
You seem to have deciphered the scenario i was trying to generate however. Your points regarding the geound boundry lyer with the wind, and wind effecto on the top vs the bottom of the bike is an interesting one. It kind of reinforces the importance of optimizing the aero of the rider. It also throws a gas in the fire on the concept of wind tunnel data not being very applicable.
I keep going back to the slowtwitch article on “peak aero†and am reminded that all our lab numbers, although useful, are not a great representation of the real world.
Wind tunnel testing CAN be very useful and accurate and it’s possible to make it applicable. However, I’m not convinced that’s currently the norm. But, I should make it clear that I’m basing that opinion primarily on the data and discussion I see in the public domain, and a background in aerodynamics. I’m NOT involved in bike industry aerodynamics and haven’t looked at what they’re doing sufficiently closely to speak with any real authority. I suspect there’s a lot of over-simplification going on, but perhaps I’m doing them a disservice.
Wind tunnel testing CAN be very useful and accurate and it’s possible to make it applicable. However, I’m not convinced that’s currently the norm. But, I should make it clear that I’m basing that opinion primarily on the data and discussion I see in the public domain, and a background in aerodynamics. I’m NOT involved in bike industry aerodynamics and haven’t looked at what they’re doing sufficiently closely to speak with any real authority. I suspect there’s a lot of over-simplification going on, but perhaps I’m doing them a disservice.
Well, as an engineer and outsider to the bike industry…I see a whole lot of people selling product who do their own testing.
Not a whole lot different than in the automotive aftermarket world of “our Chevy V8 headers make 35hp and 50tq extra at 3000 rpm”. Yeah, on YOUR dyno test. Go figure.
I’m not claiming the vendors fake the data, I’m saying that vendors selling wheels and framesets for aero are going to approach the research in a way that will present data that can help sell bikes.
Whitepapers on naca airfoils, whitepapers on aviation carbon layup and repair, etc…that doesn’t sell wheelsets and framesets. A consumer can’t read that whitepaper and say “I’d rather have the FLO wheels”. Sorry, just picking on them since so many people quote their aero wheelset tables/data.
People can read a chart of watts or minutes in an IM bike leg though.
I tend to trust CRR data for tires/tubes a lot more since it’s a much more isolated system than the aerodynamics of the entire rider/wheelset/frameset system.
I tend to as a consumer operate within a more “widely accepted facts” standpoint on the aero. Then let my overall budget guide me.
As for the minutiae of intricacies of super premium wheel “A” vs. “B”. Meh…