.

Two things.
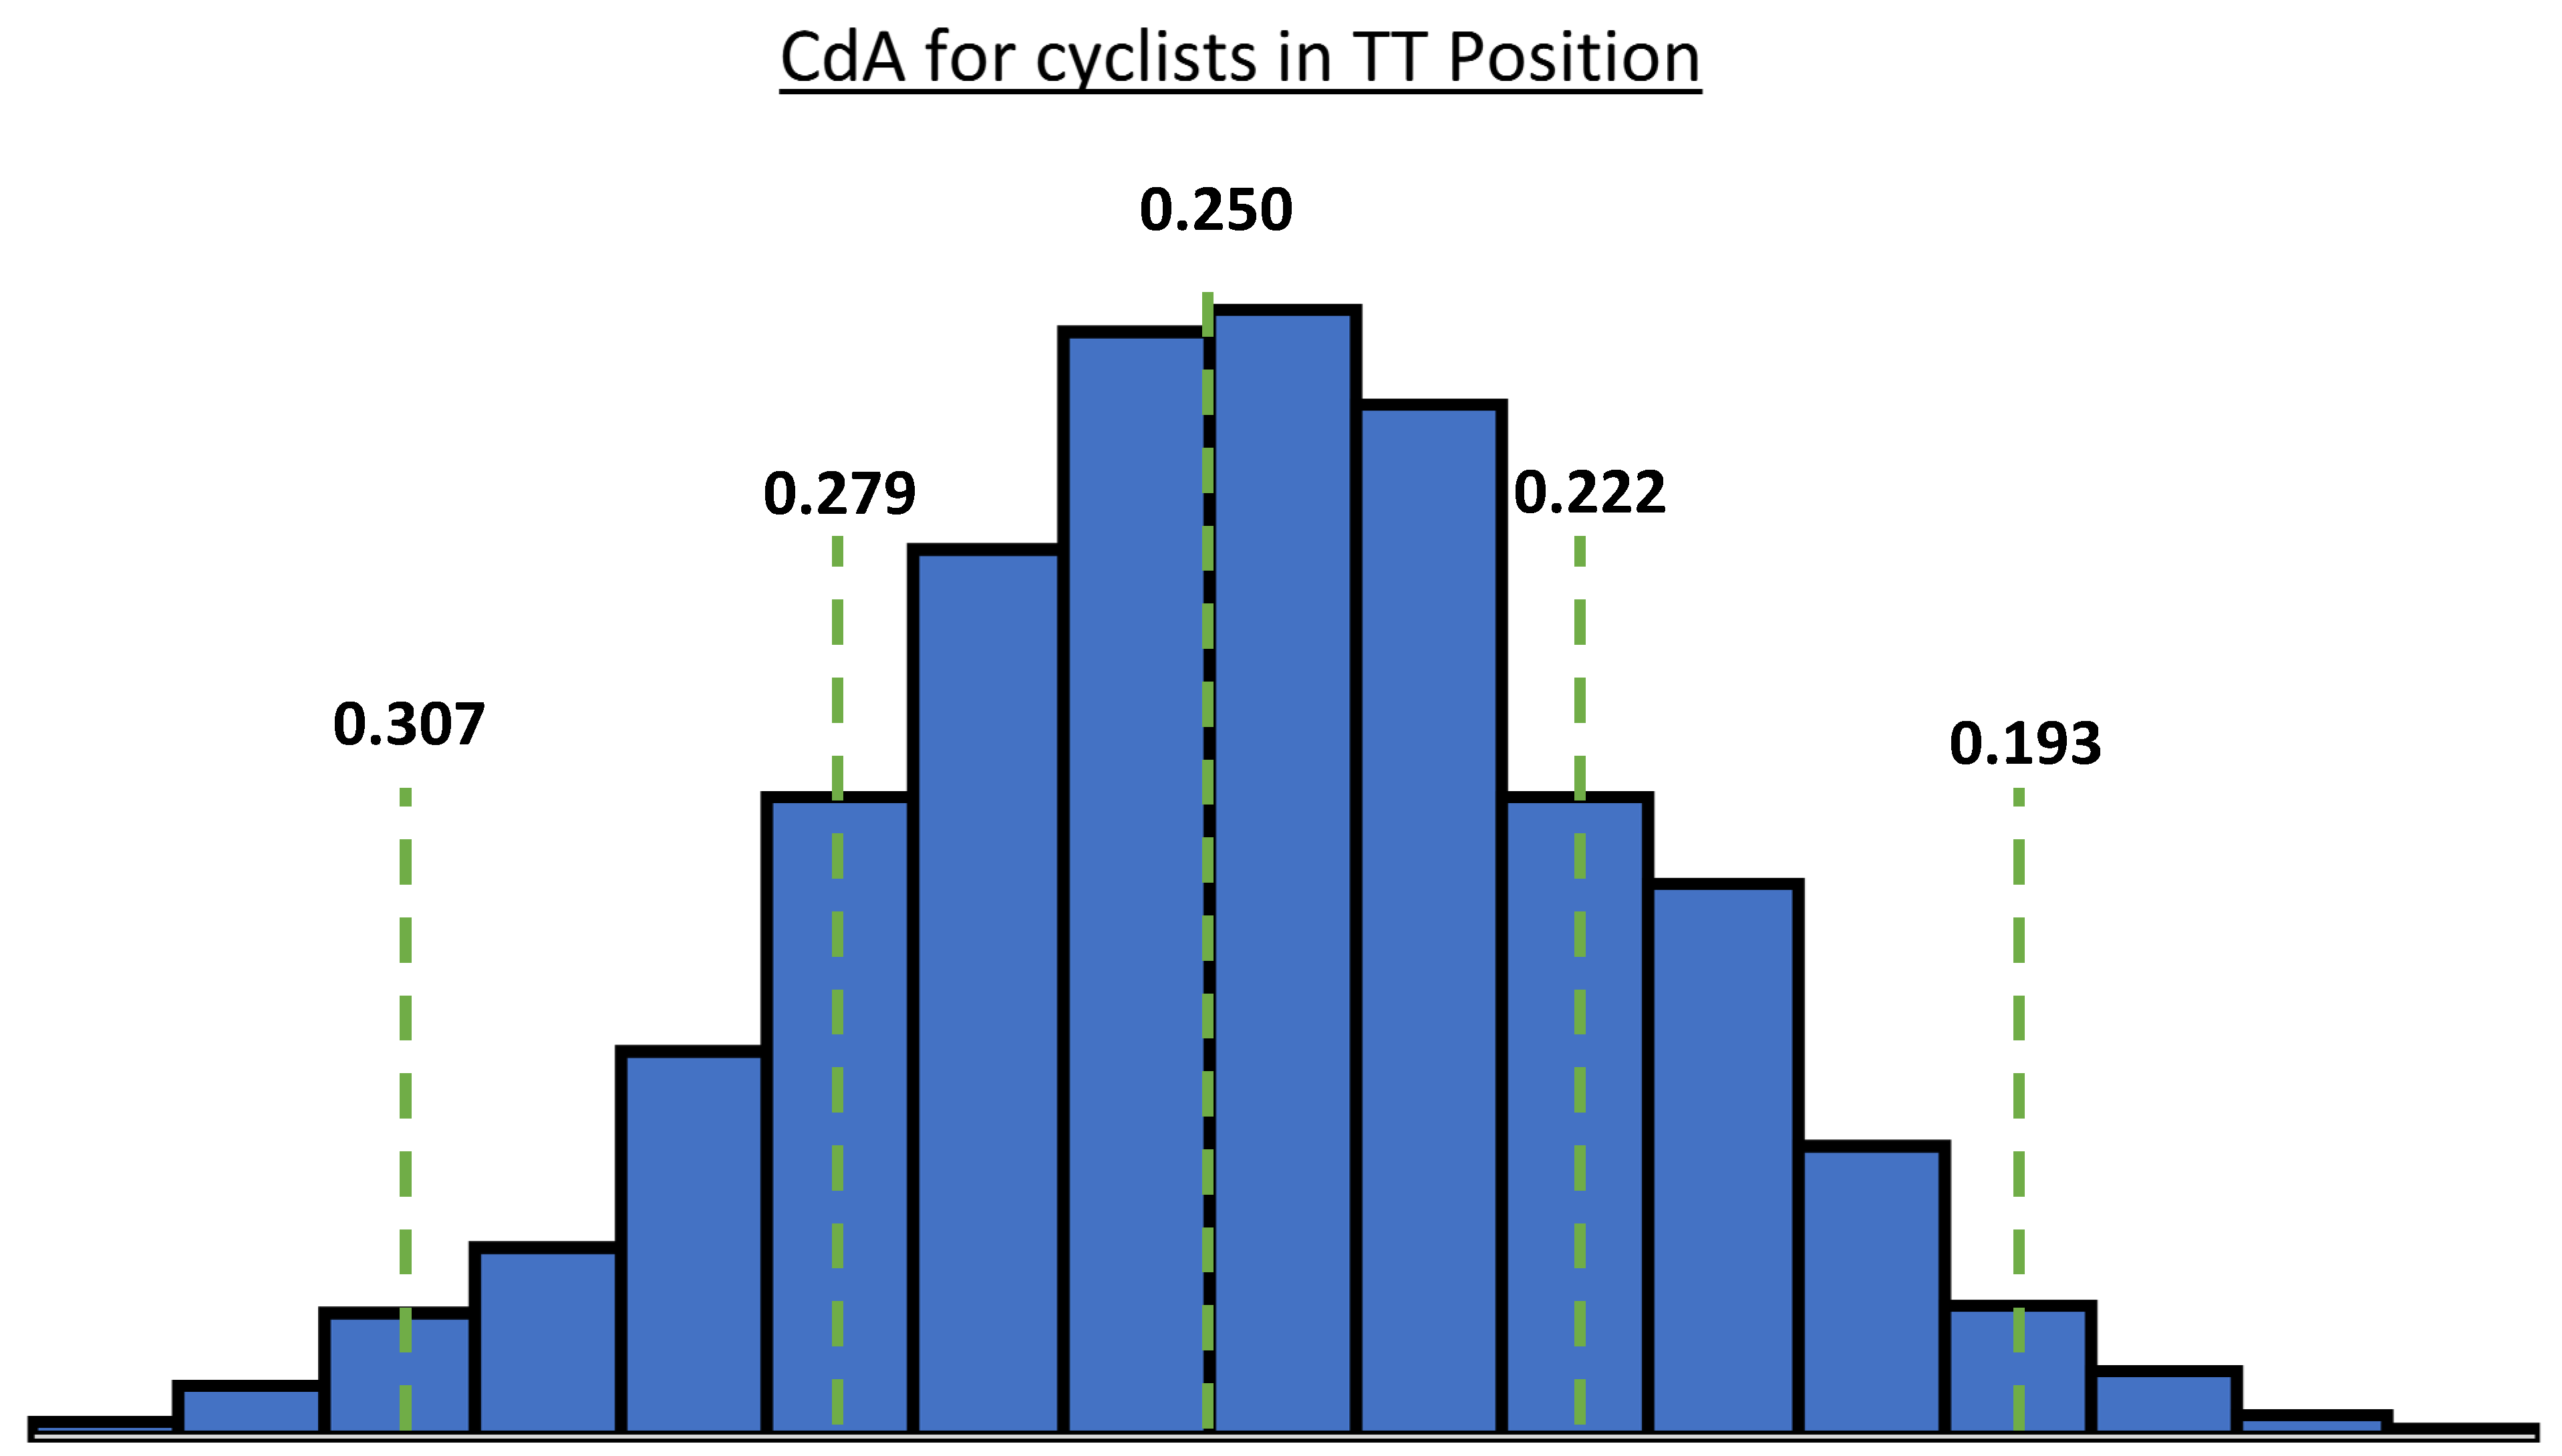
First is that low CdA represents a high percentile (as in, only this few % of people achieve this), and thus should be on the right.
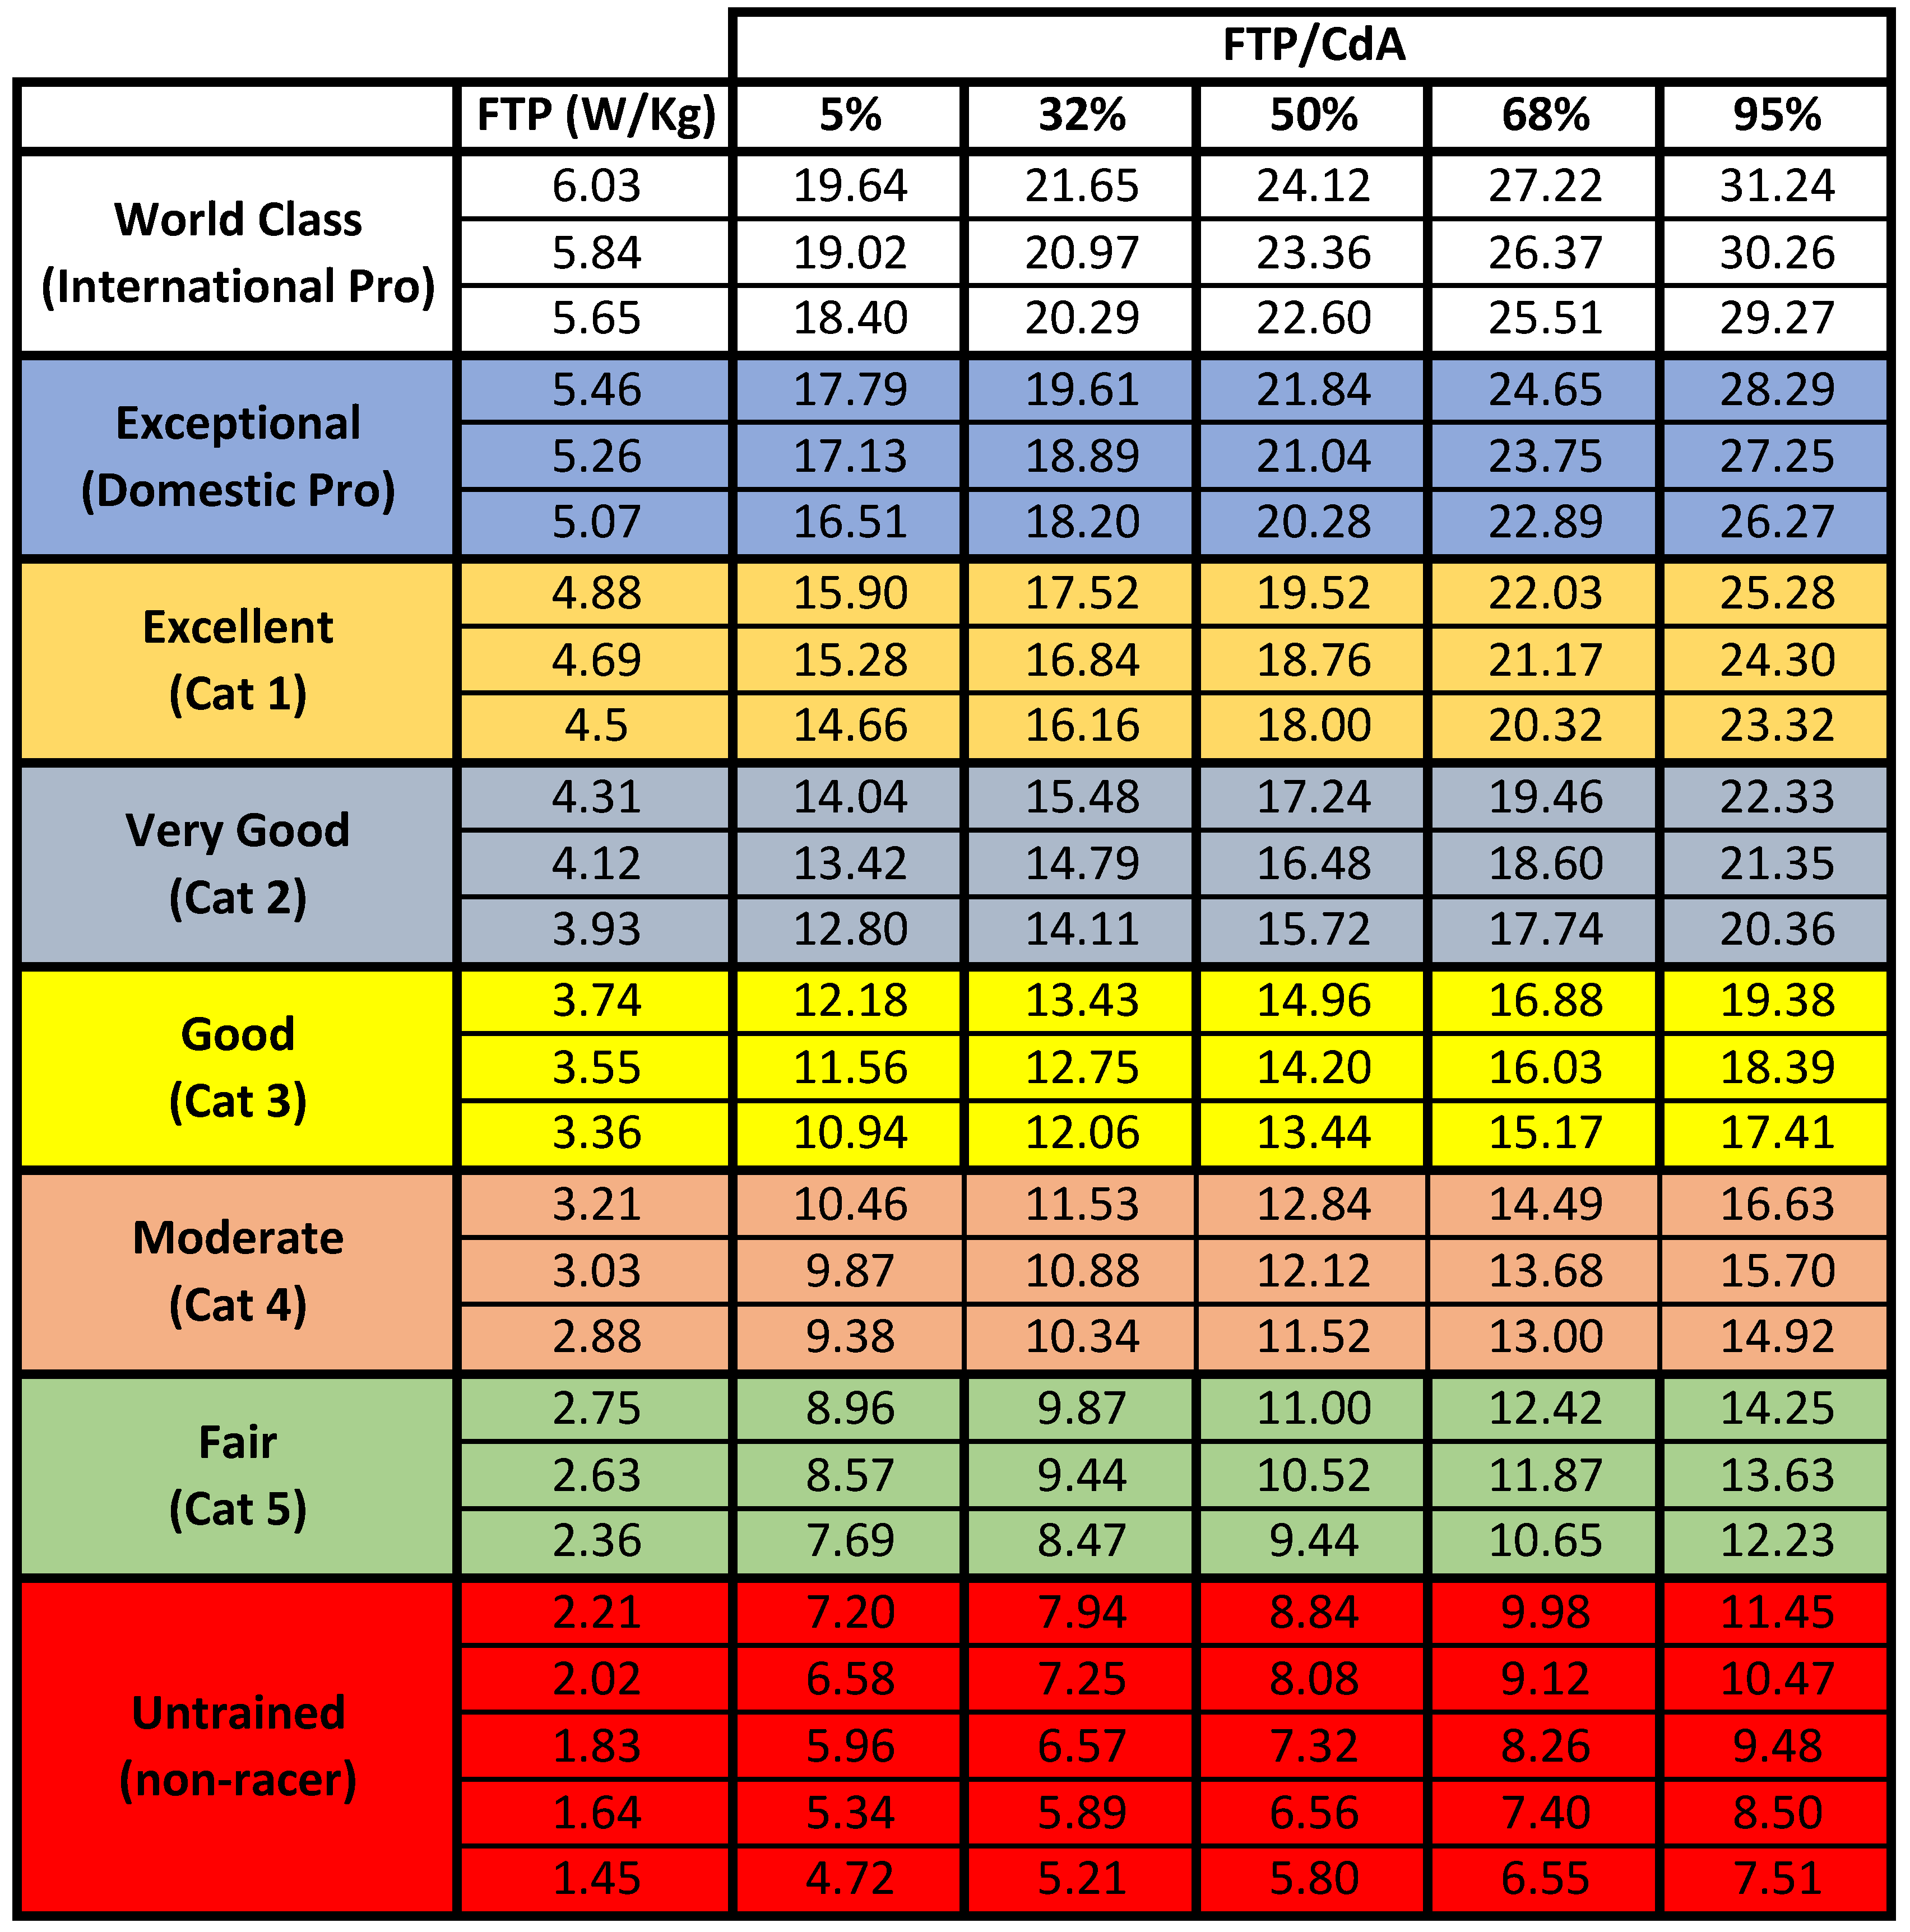
Second is that this has been discussed before, with RChung expressly posting a W/CdA chart
Nice. I have seen that plot before. Not quite the same as a table of values, but works nonetheless.
I have now fixed the histogram so the 95% matches to the 0.193 CdA (left to right).
Also, the gaussian curve defining the mean and standard deviation of CdA was based on data - informed from the CdA measurements over the last 4 years.
For FTP/CdA, is the FTP still in W/kg or just W?
I think it should be the latter since weight doesn’t matter in a flat TT. The only way it does is in correlation with A, but then you’re double-counting the impact of A in FTP/CdA
For FTP/CdA, is the FTP still in W/kg or just W?
I think it should be the latter since weight doesn’t matter in a flat TT. The only way it does is in correlation with A, but then you’re double-counting the impact of A in FTP/CdA
Indeed, it is setup as W/Kg. I agree, weight does not matter (except for the general trend of increasing A with body mass). That said, the Coggan chart is a categorization system of sorts that I decided to let stay as-is.
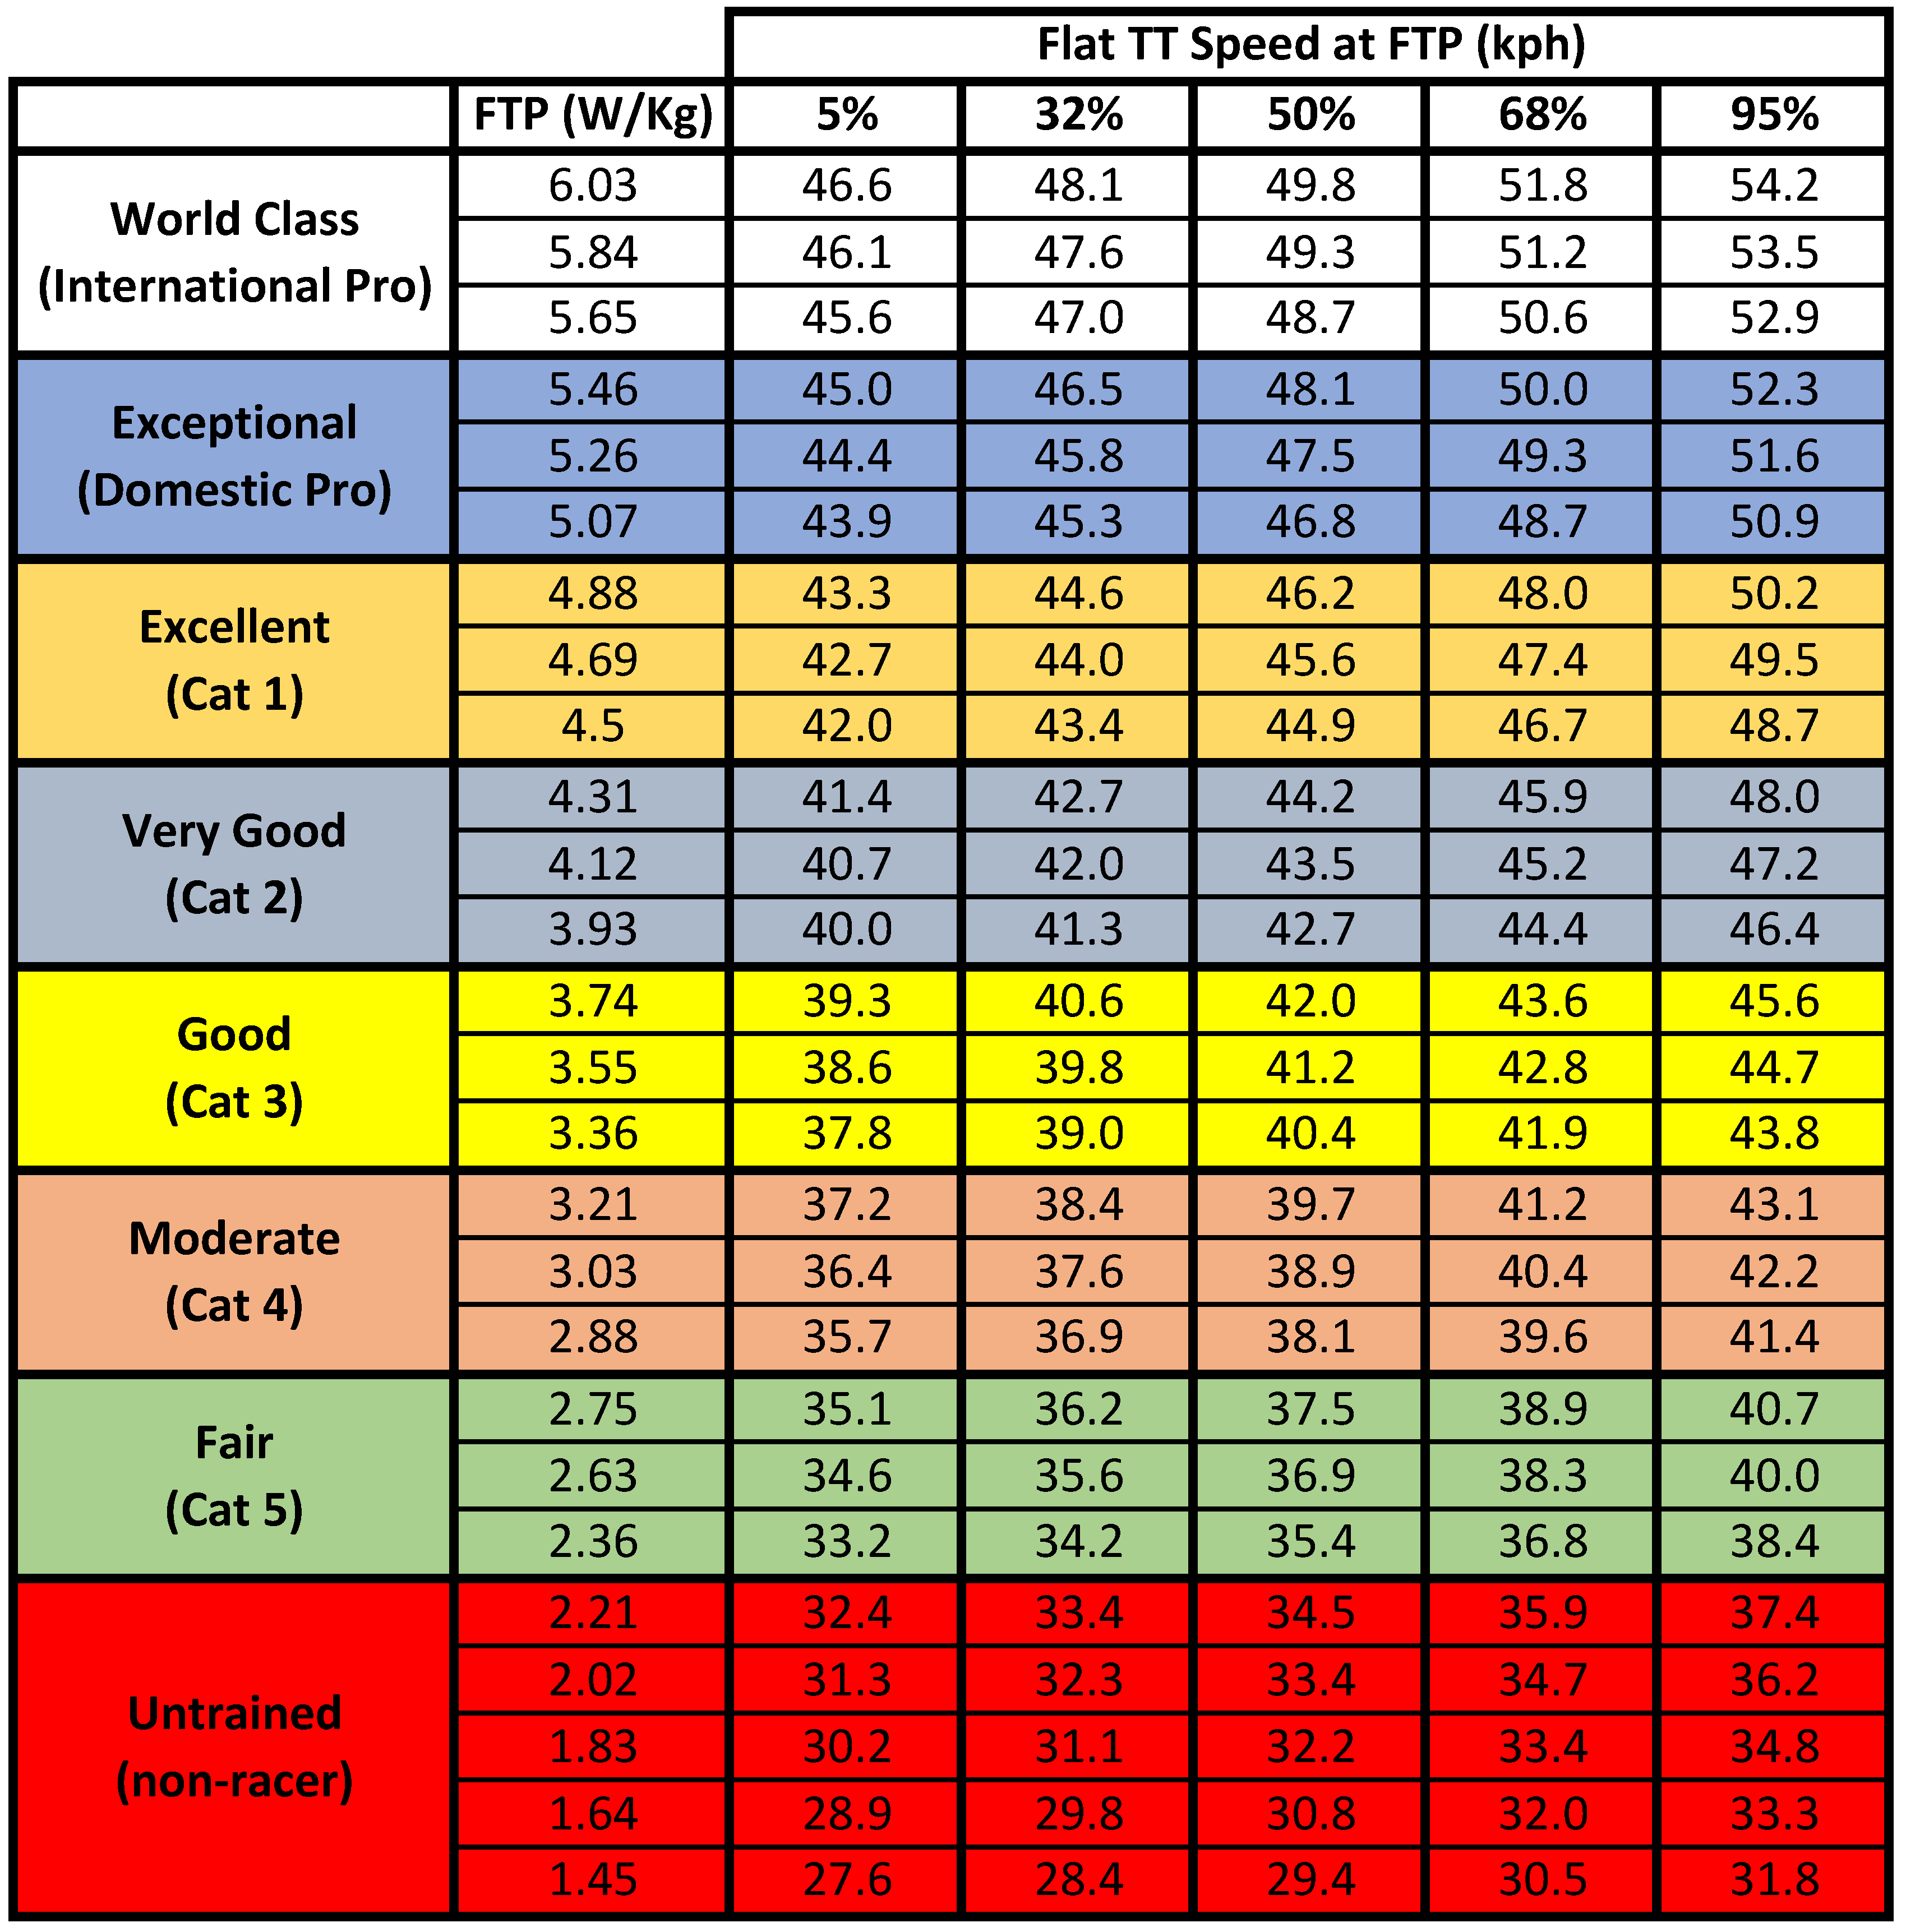
The flat TT speed is based on 75Kg rider. Mass does still matter when computing the realistic speeds since rolling resistance must be included in the steady state calculation…
I could do the chart using just Watts, but I am not sure how to categorize riders in terms of Cat A, Cat B, etc. based on pure watts. Its tricky.
Suggestions?
My experience is the distribution of CDAs will be different for each category of rider
For example, I don’t believe the average CDA is 0.25 in “world class” category. A 0.25 is pretty bad for a WT rider.
On the other end, take the finisher pix of a typical Ironman, and the average CDA is well north of 0.25.
However, I would bet 0.25 is the average of active participants on ST ![]()
When you say flat tt speed, what’s the distance on that? We talking 40k, 20k, 10mi, or something else?
It says @FTP, so assuming it’s for 1hr
.
It says flat TT speed at FTP so it’s not specific to a distance.
If your time to exhaustion (TTE) is 60 minutes, then your FTP would be what you can hold for an hour. Otherwise, it depends. Personally, my TTE fluctuates quite a bit based on the event I’m preparing for. Anywhere from 30 minutes up to about 1:15.
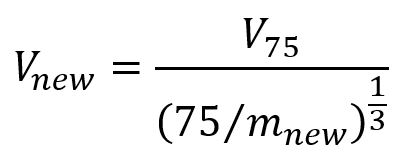
For anyone who wants to calculate steady state speed for a rider mass different than 75Kg, simply apply the following formula which is accurate to within 1% of steady state speed for masses between 45Kg and 110Kg:
(where V75 is the speed in the Table above)
.
Also, the gaussian curve defining the mean and standard deviation of CdA was based on data - informed from the CdA measurements over the last 4 years.
I’m surprised your data show the curve to be so symmetric. My observation has been that in the wild, CdA is decidedly asymmetric.
Thanks for sharing. I found it interesting where I shook out - and seemed to align with where I thought I’d be (pretty aero but not anything spectacular in power generation)
Also, the gaussian curve defining the mean and standard deviation of CdA was based on data - informed from the CdA measurements over the last 4 years.
I’m surprised your data show the curve to be so symmetric. My observation has been that in the wild, CdA is decidedly asymmetric.
Indeed, this is why I used the term “based on”. There was definitely skewness in the distribution of the results. But part of me was thinking that is because my method of collecting data has some inherent intervening variables that I had to account for to adjust the results. For example, we only collect data when someone uses an AeroLab sensor for a test. Who exactly would use an Aerolab sensor? More likely to see folks in the <0.25 CdA range, which was the case for us. So the number of samples we have at >0.25 is quite a bit lower and thus less statistically converged. You may not like how I decided to correct the results for a more representative set for the masses of folks who participate in all Ironman or Road Cycling TT events! The model gaussian fit ‘reasonably’ well. So what is shown here is illustrative - the vertical axis does not represent number of samples in each bin - it represents the distribution of the data following corrections applied for intervening variables we felt provided skewness in the result ![]()
I was present at an aero testing session for a WT team, in the velodrome where every rider got tested over a week. The guy testing was one of the best in the business, called on by many of the top teams. I think one guy was over 0.25 when they started and sure enough he is the ‘tank’ on the team.
I have been to several AGers tests as an observer. When you see them on their first baseline test a 0.28ish is not uncommon. Sure enough they get much lower but I would say a lot of AGers in a IM are there.
Thinking of results from our local TT’s including USAC regional, I feel the chart for my area is a bit generous. Maybe it includes a lot of stronger regions in the data.
Also, the USAC road categories totally screws this for ITT in the US. You get a stinker of data points in ITT because USAC ranks riders by mass start road points, not ITT results.
Below I computed the mph for the men’s categories from our regional 40k champs. I just feel like these are slower than that chart shows. The middle of your chart for P/1/2 of 50% is like 28.5mph. Here, it’s more like 27.5. 1mph is significant.
In the 4/5’s I feel the top third is often hobbyist TT folks or triathletes with no mass start points.
I don’t think categorizing the chart with USAC mass start categories is too helpful IMO.
Male Cat 1/2 ITT 30.83640066 Male Cat 1/2 ITT 30.3784912 Male Cat 1/2 ITT 28.04205418 Male Cat 1/2 ITT 27.6105942 Male Cat 1/2 ITT 27.49518834 Male Cat 1/2 ITT 26.6564393 Male Cat 1/2 ITT 26.63121474 Male Cat 1/2 ITT 25.48667411 Male Cat 3 ITT 27.54740918 Male Cat 3 ITT 25.27982647 Male Cat 3 ITT 23.89352266 Male Cat 4/Novice ITT 26.56997845 Male Cat 4/Novice ITT 26.4626542 Male Cat 4/Novice ITT 25.85391949 Male Cat 4/Novice ITT 25.53049592 Male Cat 4/Novice ITT 25.21809939 Male Cat 4/Novice ITT 24.56160186 Male Cat 4/Novice ITT 23.72118092 Male Cat 4/Novice ITT 23.6591981 Male Cat 4/Novice ITT 23.33173468 Male Cat 4/Novice ITT 23.02624966 Male Cat 4/Novice ITT 22.79503875 Male Cat 4/Novice ITT 21.98450815 Male Cat 4/Novice ITT 21.65105761 Male Cat 4/Novice ITT 21.23451499 Male Cat 4/Novice ITT 21.22741639 Male Cat 4/Novice ITT 21.16575812 Male Cat 4/Novice ITT 19.66222877 Male Cat 4/Novice ITT 18.18402605