Ya, there’s that too! $10 million for the garage or just use more street for transition and then we can make it top 5 in every age group ![]()
1 Like
Indeed. Something like this.
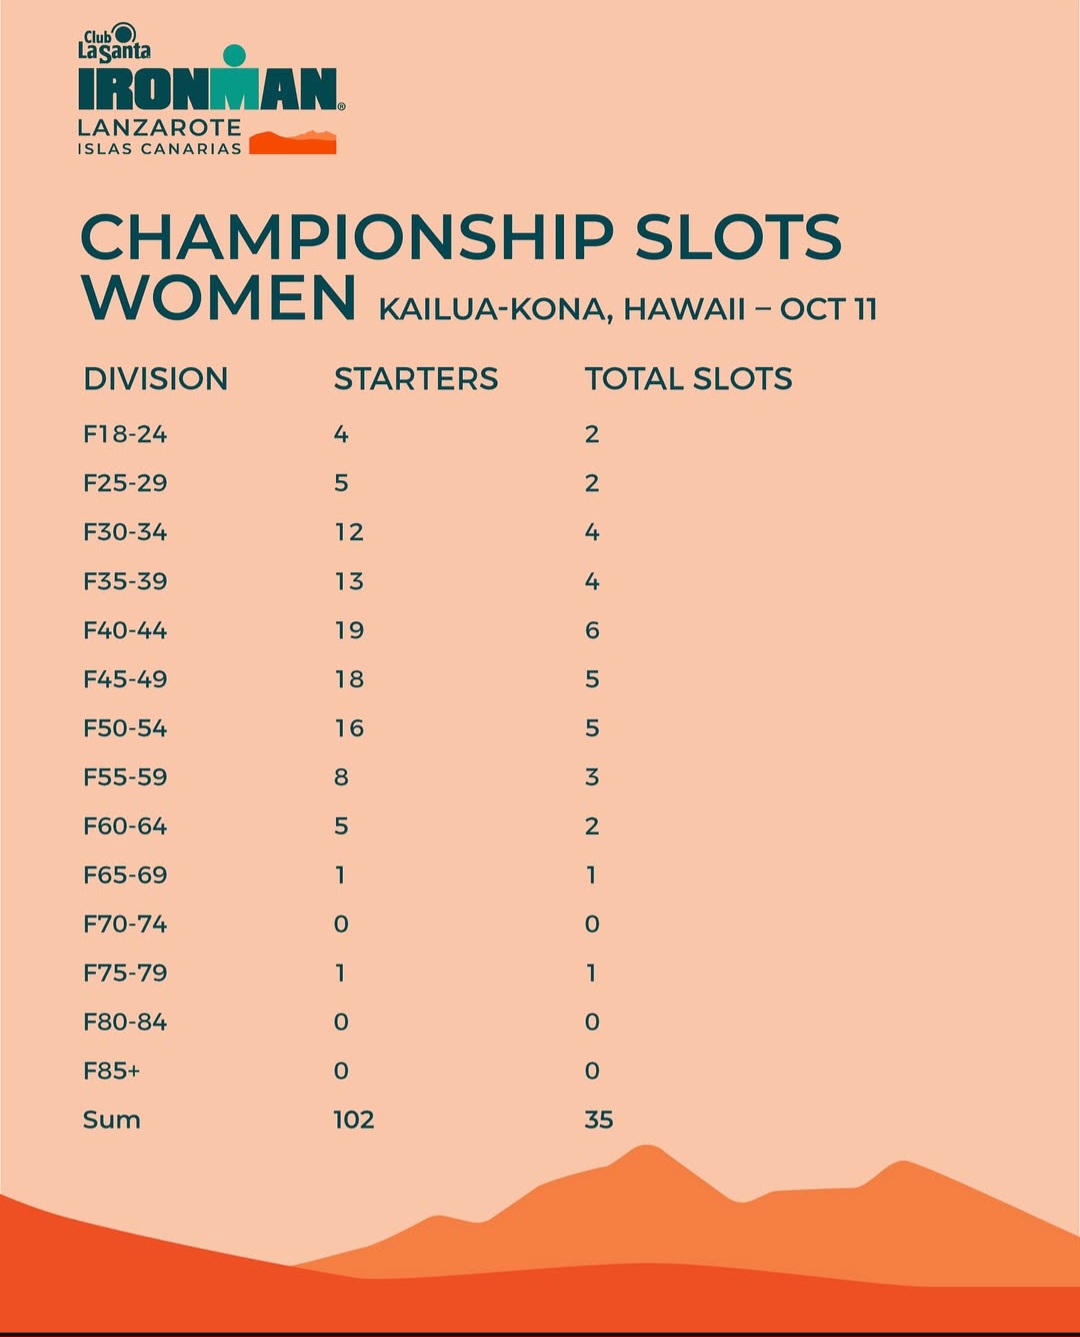
Pretty good odds for the ladies in all categories.
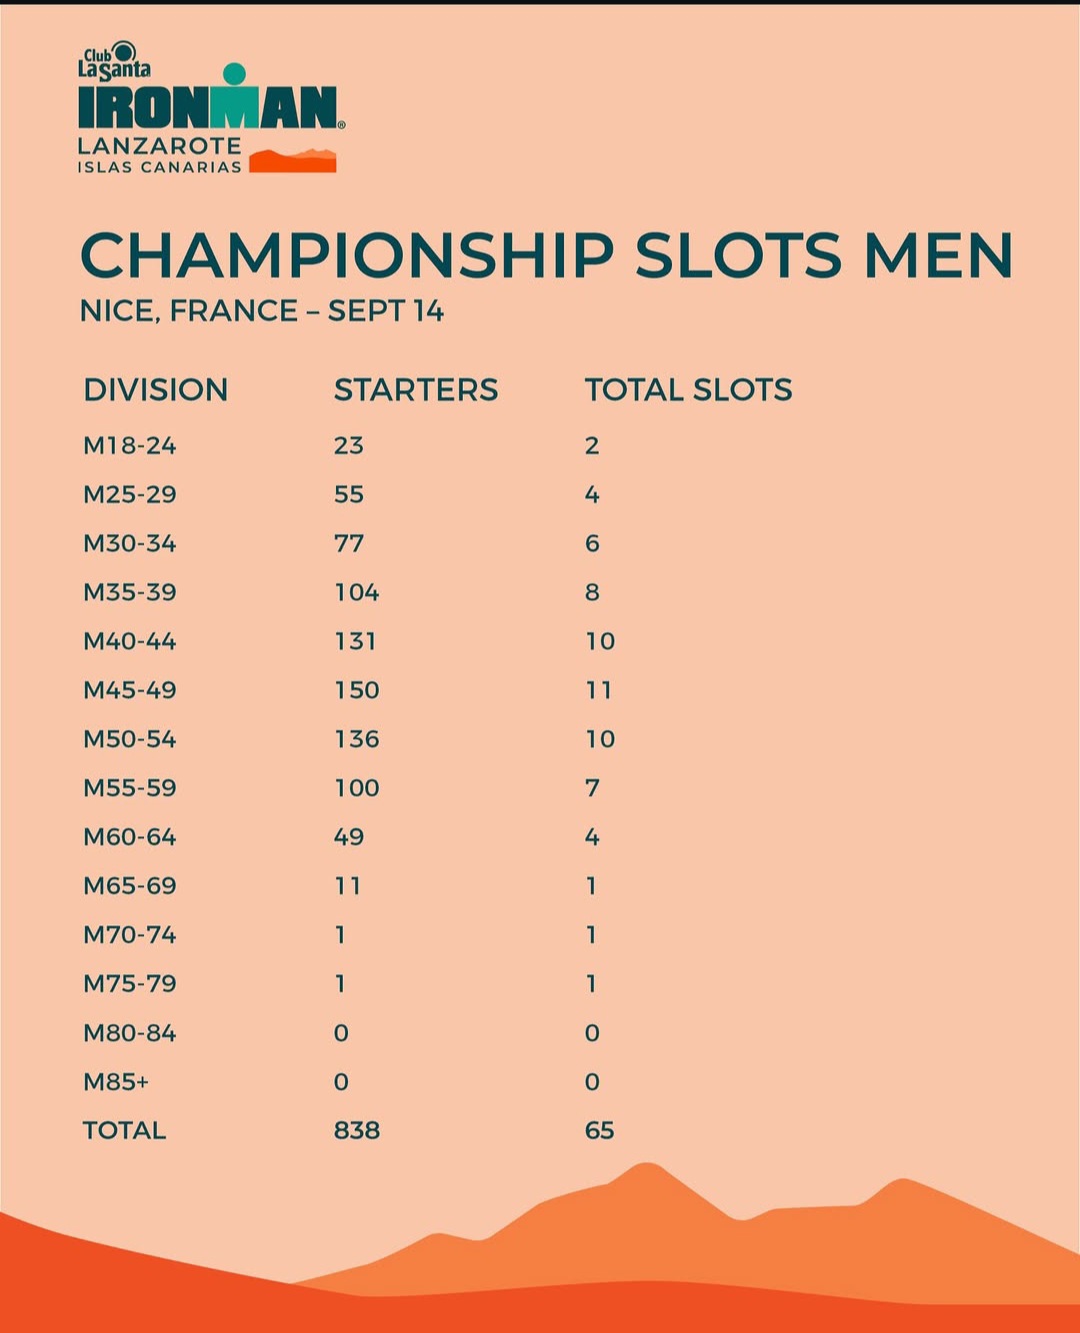
Is this a low turnout year? Numbers don’t seem great, for ladies or men.
2 Likes
Yeah,and those are the starter numbers so you have to think the odds are actually better with the DNF’s
This year about the same as last year and little less than the year before last.
2023 Starters 1127 Finishers 842
2024 Starters 1082 Finishers 899
What struck me was the remarkable similarity of overall numbers and gender split to Ironman Australia earlier this month.
1 Like
Wow you’d have to think that several of those women’s slots are going to roll into another AG considering there are only 88 finishers. It’s such a bizarre business model up think they can fill a world championship from a customer group of 100+ finishers in so many races. It’s one thing to say the women need to turn up but it’s another to set them up for failure entirely. It seems like the model could have worked better to have a women’s day that shares the day with some targeted male ags like they did in their 2 day Kona event
1 Like
So here are some interesting stats that relate to gender splits in one of Ironman’s non-triathlon races.
Ultra Trail Australia was run this weekend (Beth McKenzie on the podium again) and the gender split is interesting. It seems that, just like in Triathlon, the longer the race the less interest there is with female runners. Again, perhaps different interests and different priorities?
Ultra-Trail Australia Gender Split | Electric Cable Car
- UTA100 (100km) Starters: 983, DNF: 149, Finishers: 834 – 163 women 19.5%.
- UTA50 (50km) Starters: 1,940, DNF: 82, Finishers: 1,861 – 709 women 38%.
- UTA20 (23km) Starters: 1,981, DNF: 9, Finishers: 1,972 – 1,116 women 57%.
- UTA11 (11km) Starters: 724, DNF: 1, Finishers: 723 – 443 women 62%.
1 Like
When we deal with generalities there will always be exceptions. But when we deal distribution curves it’s at the tail ends of those curves that the exceptions really start to manifest themselves.
In the distribution of triathlon, running etc. you’re essentially pushing out into those tail ends of the distribution curves as the distance increases.
It’s a troubling fact to articulate this because it sounds sexist in so doing its always tempting to point to exceptions or make logical sounding arguments. But the reality of those distribution curves don’t go away. ![]()
1 Like
I checked the finishers at the last IM70.3 Lanzarote between genders in 2023 and it was 154 women and 780 men so definitely a different distriubtion for half the distance at the same venue
Women in Tri UK offer evidence-based argument that performance-based allocation more accurately upholds the foundational values of triathlon: fairness, determination, and equal opportunity - than models based primarily on participation.
IRONMAN to review World Championship slot allocation model after concerns raised for amateur women
A performance-based analysis report from Women in Tri UK, a charity committed to bringing gender diversity to the sport, concludes that a participation-based slot allocation model for the IRONMAN World Championship would significantly disadvantage high-performing female amateur athletes. The analysis, based on the last 12 months’ IRONMANs showed that whereas women made up just 17% of starters the female athletes were way higher quality (as measured by % behind their AG #1).
The key finding from the report suggests that a woman is more than twice as likely as a man to finish near the front of her field (within 15% of their AG #1). Yet under participation-based slot allocation models (i.e. 17% / 83%), athletes of the same quality will be less likely to qualify for Kona if they are female.
The report defines “high performing AG athletes” as those finishing within 15% of the winner’s finishing time in their age group and states “In many races, women receive far fewer slots despite producing a greater share of top performances. The outcome is an [IMWC amateur] start list that does not reflect the true competitive landscape.”
“Based on this ‘high performing’ threshold, Women in Tri UK estimated a performance-based slot allocation across the 35 races, with a guaranteed slot for each AG winner in both genders. This results in an average of 35% of slots allocated to women globally, with individual races ranging from a minimum of 25% slots at IM Frankfurt to a high of 50%—equal numbers—at IM Texas and IM Taiwan.
The Women in Tri UK preamble when presenting the report to IRONMAN asserted “The top end of the women’s field is already comparably as good as the top of the men’s field. What the women’s field lacks is a large quantity of middle-of-the-pack athletes” and concludes: “Women in Tri UK advocates for an approach that recognises performance.
IRONMAN have confirmed its stated intent to “review its proposed slot allocation model” and that “as we return to our historic roots in Hawaii for the IRONMAN World Championship in Kona we also value the constructive ideas and feedback” and “we have had very positive dialogue with Women in Tri UK . . . and look forward to continued discussions with them and others as we consider our final approach to 2026 slot allocation – along with other ideas that can help grow women’s participation in the sport and shape a fair, competitive World Championship that excites and inspires both current and future athletes.”
Extracted and precised from:
And here’s the report:
1 Like
This is the general idea that I was trying to get to way at the top of the thread. Define qualification based on objective performance, rather than raw participation.
After reading this, it could make the KQ process very swingy - right now for better or worse we have a general idea how many slots are in each age group, and putting something like this in would mean that the gender balance could swing from 25% to 50% (as examples) from one race to the next. I assume that each race is probably relatively stable competitively year to year, but it means that its another unknown before you sign up to race.
The benefit though is that it puts qualification in your own hands. Put up a competitive time (however defined) and you’re in. No more missing Kona by a half second because there’s one more competitor in your AG than you expected, even on the men’s side, and while there’s still luck involved (if your AG is hit by a former pro or someone who should be pro) its still mostly in your hands. Even Boston has some variability - you need BQ time less 4-7 mins, but you don’t know the threshold.
On another note - the article leads with " IRONMAN to review World Championship slot allocation model after fears raised for Age Group women"
Is this the first mention that they’re taking a definite 2nd look, or is this just following on DeRue’s “mostly proportional but we’ll see” at the Kona announcement?
Now having read the report, I am going to point out one overreach in the analysis - notably…
IRONMAN Philippines had only 22 women starters—just 5.85% of the total field. Yet 16 of them (73%) finished within 15% of their AG winner’s time, compared to just 25% of men. This means women, while few in number, dominated in relative performance.
Yeah, if you only have 22 starters, a big % of them are just going to outright win the age group, and therefore be defined as a top-tier athlete. I’m very much in support of this project, but please remove the outlier races before you do the analysis.
On a better note…
Even in races with a relatively larger women’s field, such as IRONMAN Texas, the pattern holds. Women accounted for 28.45% of starters and, strikingly, produced more top Age Group athletes than men in absolute terms: 94 top performing women vs. 90 top performing men. A total of 51% of the top Age Groupers were women.
If I was IRONMAN I’d be looking at two aspects to confirm the evidence analysis supporting the thrust of this report.
- Using the winner of each AG is as you put it, ‘swingy’. For consideration using the mean of the first 3 and a lower % might be sounder.
- I’d do sensitivity analysis on Women in Tri UK’s arbitrary 15% figure$ being used to define ‘high/top performing’ athletes. Given the figures (see below) any ‘performance-based’ slot allocation threshold would need to go lower; ?10%.
$ The 15% figure (according to GTN) was chosen as it’s a % used by BritTriFed for AG standard for getting into races styled ‘world’ or ‘Euro Champs’ as an amateur eg Ibiza '23, Townsville '24.
Separately, (and the report touches on this - see paste below) any ‘roll down mechanism’ needs a performance floor (these slots are for a ‘World Champs’ after all, not some participation gig).
“In our dataset alone, the pool of top-performing athletes [men and women] (those finishing within 15% of their AG winner) totals 8,331—more than enough to fill a World Championship field of 2,500 to 3,000. Roll-downs could—and should—include a performance floor to preserve integrity.”
I’d argue that the most appropriate way to set a baseline criteria as a starting point for defining what is a high/top performing athletes is really just (total KQ slots available) / (total participants). And that if you’re arguing that this should be the method of KQ slot allocation, then that figure becomes your baseline. So if 9% of athletes KQ in a given year, you then figure out where the top 9% of athletes are with respect to the AG winner’s time and that’s your criteria. There’s probably some doubles in there that you’d have to remove, but as a starting point, its relatively easy to understand.
But yeah, you’d want to know if the numbers change if you’re using 5%, 10%, 15%, 20%, etc.
On the rolldown side, it becomes easier if you adopt my suggestion at the top of the thread to just make the next in line be % of AG winners time and you can pick across age groups. If there are enough slots for everyone who came within 8% of the winner’s time, grant everyone who came within 8% a KQ slot. Rolldown then happens for people in the 9% bucket, then 10%, etc. Unless you had a really wonky race, you’d still end up with a quality field getting the slots in almost every case.
Thanks for posting the report. The authors deserve a lot of credit – it’s a polished, well-articulated write-up, clearly very high-effort, clearly a lot of time went into it. Especially big props for sharing their data set.
That being said, the report is quite simply not interpreting the data correctly. And I think others here are making the same mistake.
Groundwork
The core argument of the report is that a gender-blind proportional slot allocation system unfairly disadvantages women, because the women’s field follows a fundamentally different distribution of abilities compared to men. It asserts that the women’s field “punches above its weight” so to speak, with proportionally more finishers coming in close to the AG winner’s time, as compared to the men’s field, indicating that “top” female performers are overrepresented compared to their male counterparts. So we need to invite disproportionally more women to WC to get equal representation of talent.
The basic facts all check out. Indeed, the data show that across every race, every region, proportionally more women finish within 15% of their AG winner than is the case for men. There are some nice pull quotes like “On average 30% of women finished within 15% of the winning time in their Age Group, compared to just 14% of men.”, “a woman who starts an IRONMAN is more than twice as likely as a man to finish within 15% of the winning time in her AG”. These statements are factually correct.
Here’s the key chart from the report:
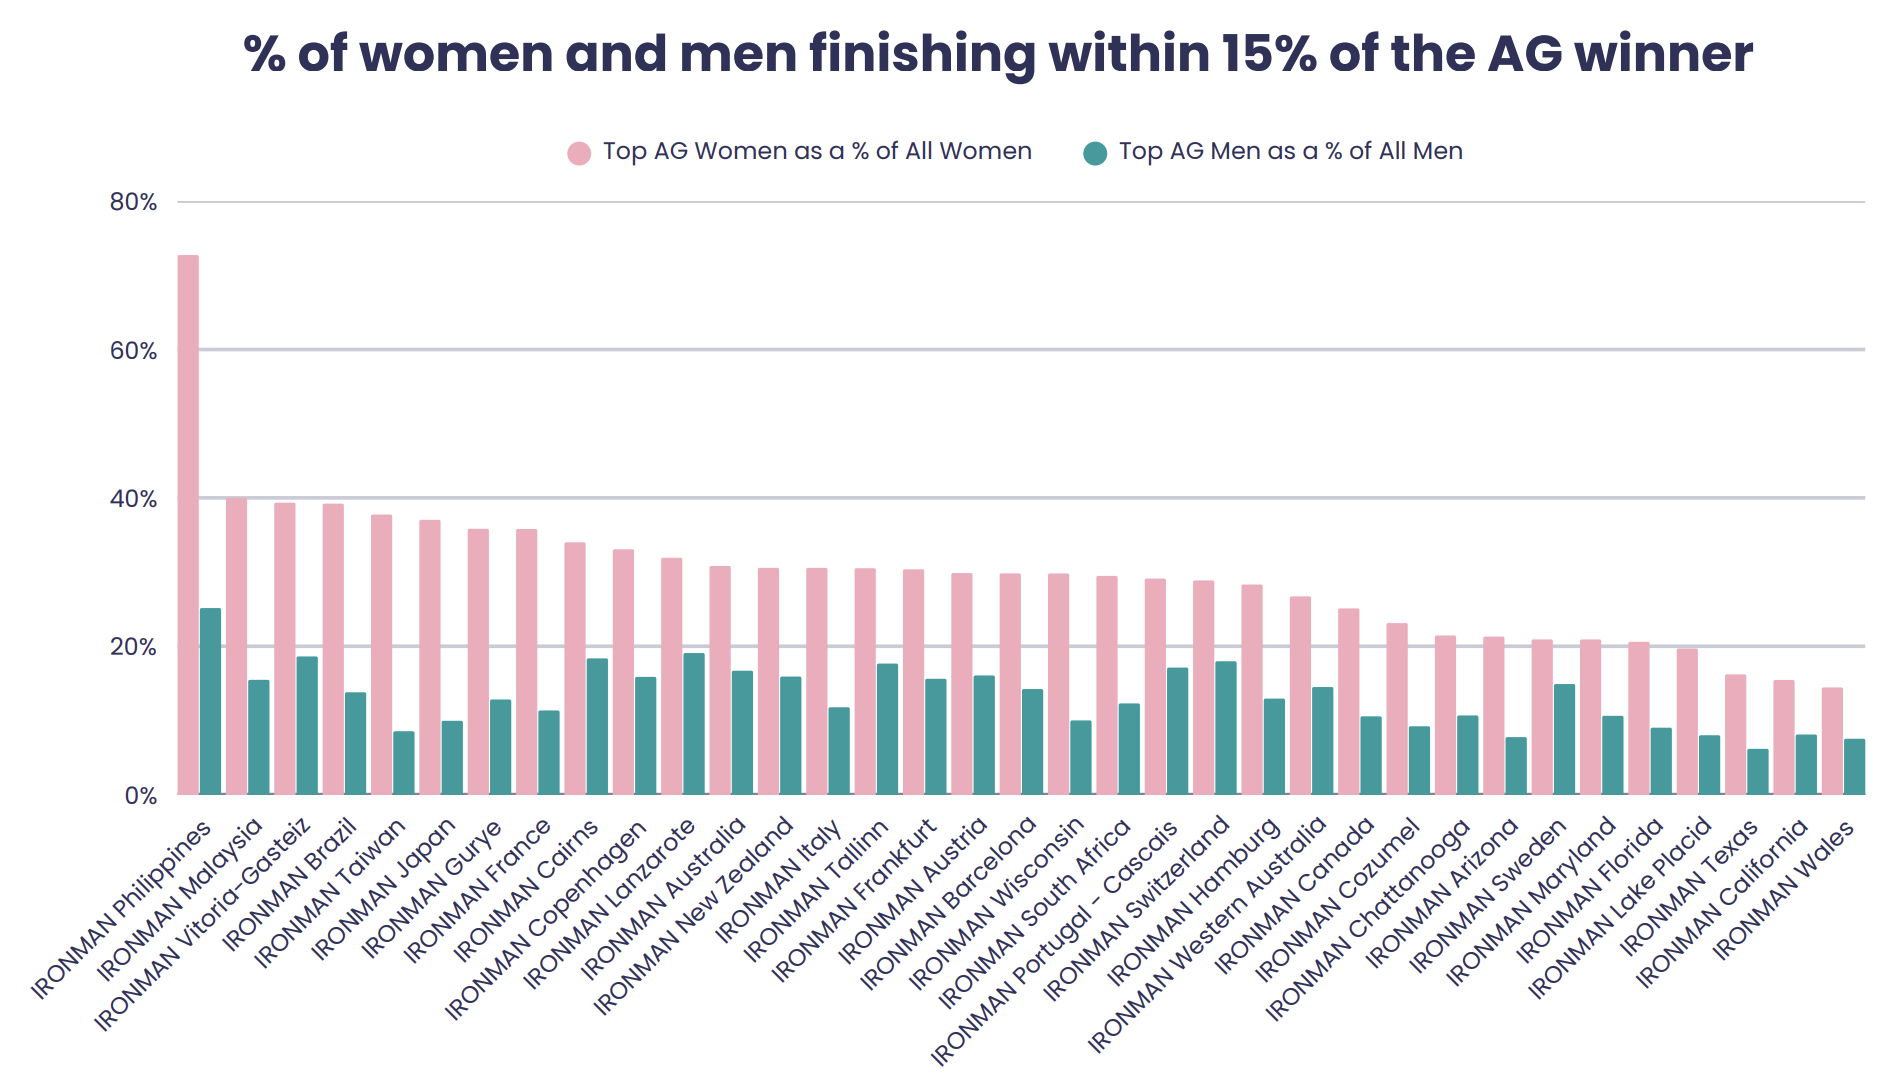
Wow, looks pretty convincing! The women are really stomping the men!
Invalid conclusion
The report takes the above facts at face value, and concludes that women must have a different, “top-heavy” distribution of talent compared to men. Pull quote: “Women outperform their numbers”.
This conclusion is not mathematically sound, and is not supported by the data.
That proportionally more women than men finish within 15% of their AG winner is a statistical inevitability given their smaller AGs, not evidence that their performances follow a different distribution. We would see exactly the same phenomenon if the talent distributions were identical.
i.e. if we took 200 30 year old men, randomly assigned 40 to “Group A” and 160 to “Group B”, and had them all race, on average we would see that proportionally more Group A athletes finished within 15% of the Group A winner’s time, than Group B athletes finishing within 15% of the Group B winner’s time. The effect is more pronounced the more lopsided the group sizes become.
It’s not an indication that talent is distributed differently in members of Group A vs Group B, it’s just how the math of small vs large sample sizes works out. This is borne out with computer simulations, feel free to write one and verify it yourself (I’ve shared mine below).
Comparison based on AG size
Ok, so I’m claiming this is just a side effect of smaller AGs, not a women vs men thing. If that’s the case, then if we normalize by AG size, the disparity should disappear, right? Thankfully, because the authors shared their data, we can try this.
Here’s what the chart looks like when you compare men and women in similar AG sizes:
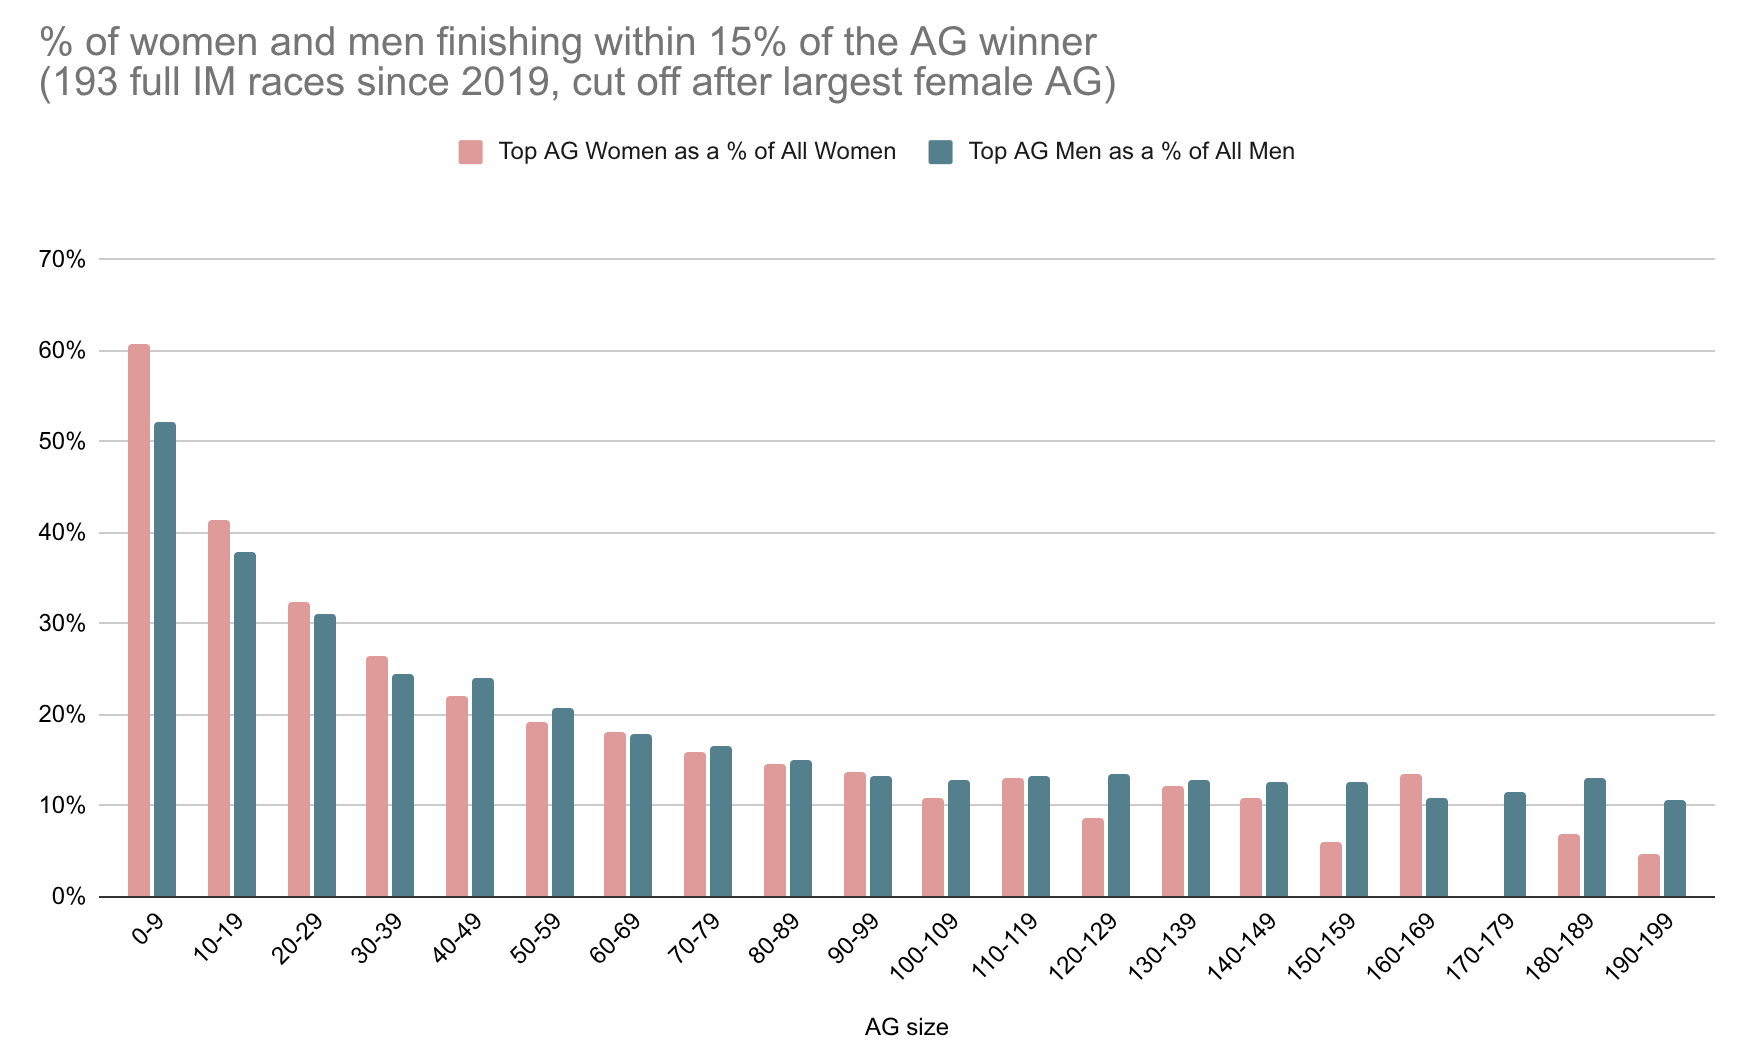
Suddenly it doesn’t seem so obvious that there is some fundamental difference in how women and men race. The bulk of the movement here comes as a consequence of AG size. The male/female disparity is reduced to noise. (Note that the extremes of this chart are less reliable than the middle, due to fewer races with these AG sizes.)
If you look at total starters per AG size, men and women achieve roughly equal numbers in AGs of size 50-60, so that seems like as close as we can get to apples-to-apples. As many men as women raced in an AG of size 50-60 since 2019.
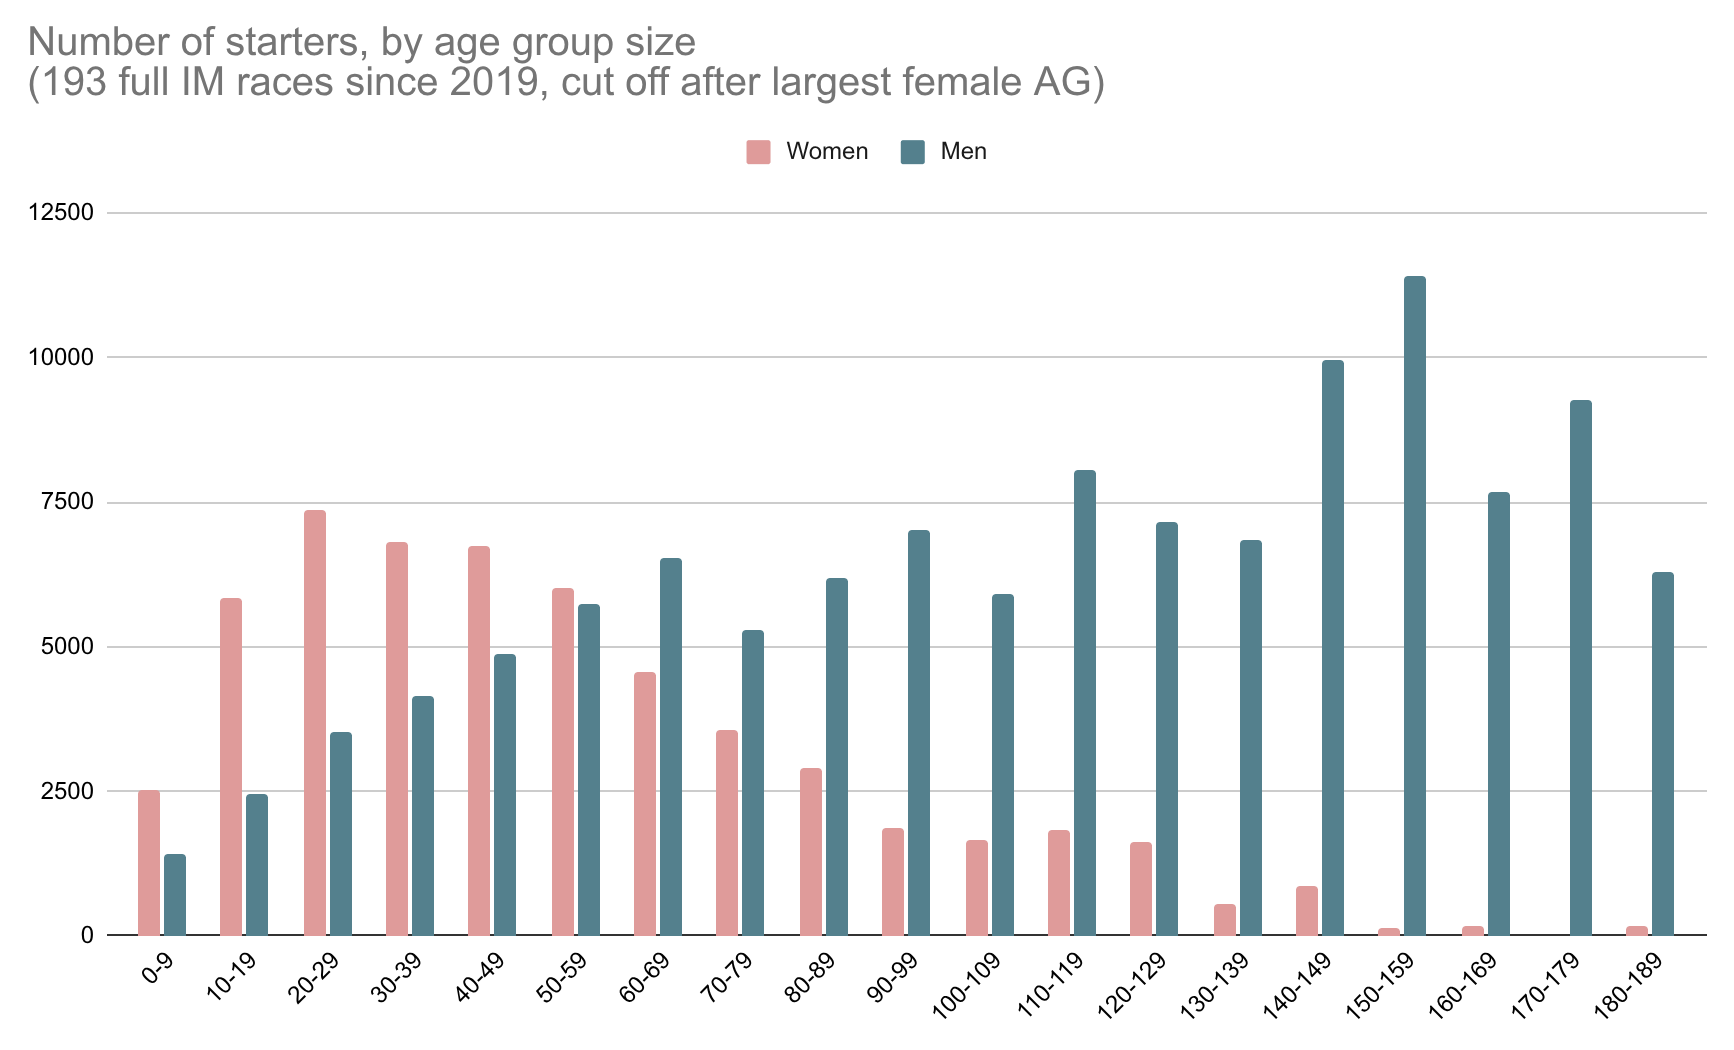
My charts above are based on the full data set published by the report authors, which includes 193 races back to 2019. For completeness, here is a version of the chart that considers only the 35 “recent” races that the report focuses on:
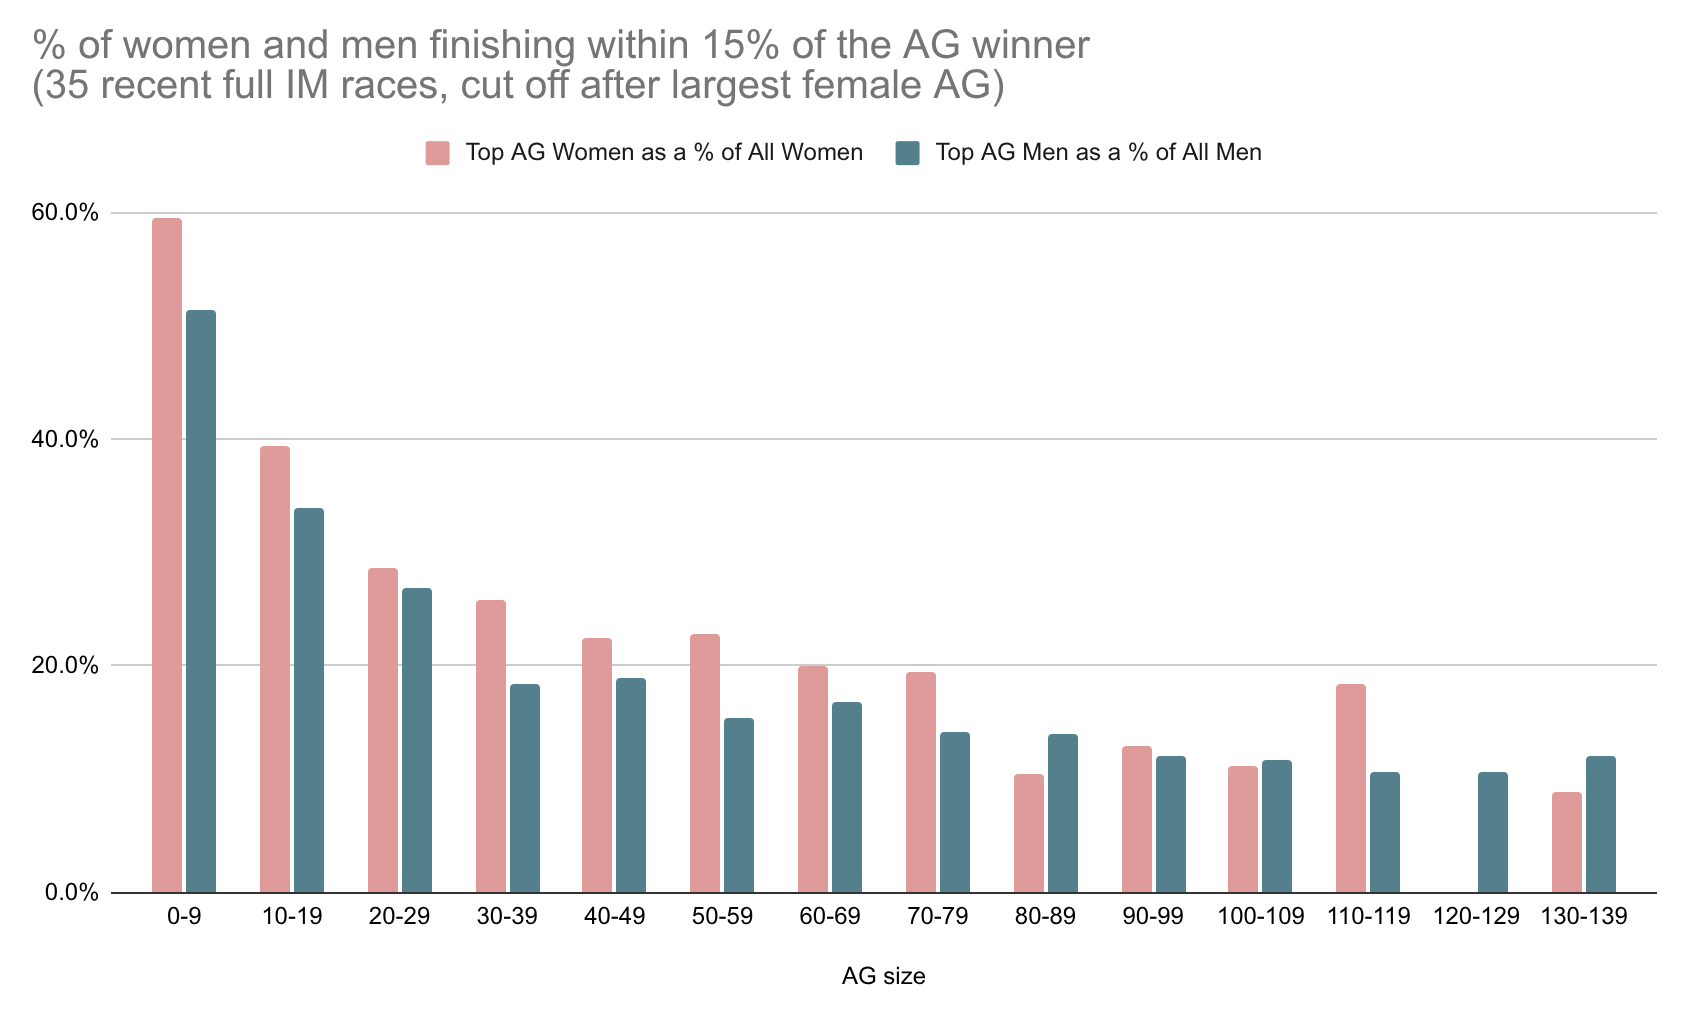
The women do make a marginally better showing in this sample. That might be statistical noise (this data set is less than 1/5th the size), or maybe an interesting indication. Keep in mind that the women looking “ahead” in the recent sample, but “equal” in the full sample implies they are “behind” in samples from earlier timeframes. Which would somewhat undermine the report’s stated rationale for a different women’s distribution – that it’s the early adopter women who are disproportionally powerhouse athletes.
Either way, this is the way people should be looking at the data – apples to apples normalized by AG size – not apples to oranges comparing same-race AGs of vastly different sizes.
Conclusion
Proportional, discrete slot allocation isn’t perfect, there are unquestionably quirks and bad outcomes. But so far nobody has shown any evidence that these quirks systematically affect one gender more than the other. The biases and quirks that this report focuses on apply equally to men and women once you normalize for AG size.
Appendix
- The report relies on Coach Cox data. Coach Cox is a super useful site, but its dataset is flawed in at least one way I’m aware of. It does not capture AGs with 100% DNF rate, i.e. there were starters, but none finished. This will skew the data for small AGs to make their % of “top finishers” artificially high. 1 finisher of 1 is counted as 100% top finishers, but 0 out of 1 is just not counted at all? These should really be counted as 0% top finishers.
- There are a ton of other interesting things to dive into which are probably beyond my ability. Let’s say the AG sizes are equal. The natural differences in male/female abilities are now all that matters. How does the 17h cutoff play into this?
- By definition, everyone in an AG finishes between 1st place time and 17h. For women, this range is compressed, as 1st place will be slower (closer to 17h) than corresponding male AG. Additionally, a slower winning time means 15% represents a bigger absolute cushion of time. So for women we are offering a bigger cushion within a smaller range of finishing times? Seems unfair…
- One thing I think actually is systematically unfair for women is using the same 17h cutoff time as men. There are women DNFing who are putting in equivalent performances to 16:30 male finishers. Surely some of them are in 1-person AGs and would have earned a slot!
- The report conveniently fails to mention that all of the “women are disproportionally fast” metrics they present are mirrored on the slow end of the field. More women are within 15% of the slowest finisher in their AG than men, too. Not because women are disproportionally slow, but again simply due to how the math works out. (Note: I have not actually confirmed this, but I am pretty confident it’s true. There is also a chart posted earlier in this thread which shows this.) So even if you buy into their analysis, by their own logic, women are somehow both extra slow and extra fast. Which again undermines the rationale that “early adopters skew toward the fast end”.
- Here’s a simple simulation that illustrates the sampling phenomenon. Written in Mathematica (lol, sorry). We model every racer as equal, finishing according to a normal distribution with mean 12 and sd 1 (roughly IM finish time in hours). Race 200 athletes, split into group of 40 and 160. After 1000 trials, despite all athletes having precisely statistically equal abilities, we see the small group is on average “disproportionally fast.”
percentWithinCutoffOfWinner[n_, cutoffRatio_] := (
  finishTimes = RandomVariate[NormalDistribution[12, 1], n];
  winningTime = Min[finishTimes];
  Count[finishTimes, t_ /; t <= winningTime*cutoffRatio]/n
  )

N[Mean[Array[percentWithinCutoffOfWinner[40, 1.15] &, 1000]]]
// 0.270975 (small group is ~27% 'top performers' on average)

N[Mean[Array[percentWithinCutoffOfWinner[160, 1.15] &, 1000]]]
// 0.123325 (large group ~12% 'top performers' on average)
8 Likes
Wow. Extra Kudos for the post and detailed explanation.
Do you know if the distribution holds once you remove the AG winners?
I think we all agree at that every AG should get at least one slot for the winner and we’re quibbling over what’s left. So if you remove the AG winner, are you able to tell quickly what the distribution looks like when you’re now dealing with P2 and below? (Or is that tons more work?)
Thanks for all of that! It was my first thought reading the study that the lower participation rate would inevitably result in that correlation in performance.
1 Like
I also suspect that the percentage of motivated “competitors” versus “completers” would be higher in the female ranks once they step up to the Iron distance and beyond.
That’s a good point, most of the women I know who do Ironman’s on a regular basis are all competitive and interested in WC slots. My wife was a one and done.
No. The dataset shared by the authors isn’t that detailed, it’s already pre-processed and aggregated at the AG level.
This also kind of gets at my quibble here.
Defending the guaranteed 1 slot is in essence defending a competition-based evaluation model. i.e. the AG winner is the definition of a “top performer”, “WC caliber athlete”, etc, regardless of the objective performance, regardless of AG size.
Guaranteed 1 slot is incompatible with an objective standard based model. You can’t say “a WC caliber time for 35F on this course is X hours” but also defend a guaranteed slot. What if nobody meets the standard? The BAA doesn’t care if you won your AG at your local marathon.
The hypothetical alternative systems being floated here are sort of trying to blend competition-based and standard-based, and that just sets off some alarm bells for me. So you don’t care at all how fast or slow 1st place is, they are automatically a “top AG athlete”, obviously deserving of WC bid… but the moment they cross the line, suddenly everyone else needs to meet an objective standard of +15% (or whatever) to be deemed WC caliber? As others have pointed out, adding a single outlier finisher can disqualify a bunch of people who otherwise would have been viewed as WC caliber with no change to their performance. How is that any less of a shitty, “that had nothing to do with how well I performed” outcome than what happens sometimes today?
Ok so we fix that by averaging the top 3 times…
Ok but not all AGs have 3 finishers…
Ok maybe we’ll keep proportional competition-based slots too, but then add more if there are finishers within X% of the winner(s)…
Ok maybe we have reserved, cross-race pools of “bad breaks” slots…
Ok maybe we reserve slots for overall top-N…
Ok then we’ll also cap the rolldowns to prevent slow finishers from qualifying…
But wait should we differentiate a rolldown due to someone already accepting a slot at an earlier race, from a rolldown due to someone just not wanting it? How do we know the difference if that person just doesn’t show up at awards?
And on and on and on… People, are you serious? This is insane.
You want a system that rewards sporting performance? Win your AG. Done. Get top 2, or top 3, or top 5 in your AG. Done. That sounds like a clear goal that a motivated competitor can aim for, and with some support from friends/family providing splits, something they can put into practice on the day.
Similarly a pure objective standard system. Finish under X hours. Done. You don’t even need splits for that.
These elaborate hybrid schemes cross-referencing N other competitors, maybe from other AGs, maybe finishing before and after you, possibly even other/future race results? No chance this is actionable on race day.
1 Like