This has been a little pet project for a bit. I don’t have a home computer really, only some pretty restricted usage work laptop and phone. Can’t really use some websites and programs. So Golden Cheetah is out. I don’t pay for TP, and have used Excel for a while to track stuff.
I never really paid a lot of attention to it other than to see my values change when I would prepare for an event. Like, lots of TSS and Z2 and SS work before a gravel grinder. Then switch over to threshold/VO2 for road stuff, etc..
I know other stuff can probably do this, but I was curious as to how good or bad I was at choosing and executing some work in the right areas.
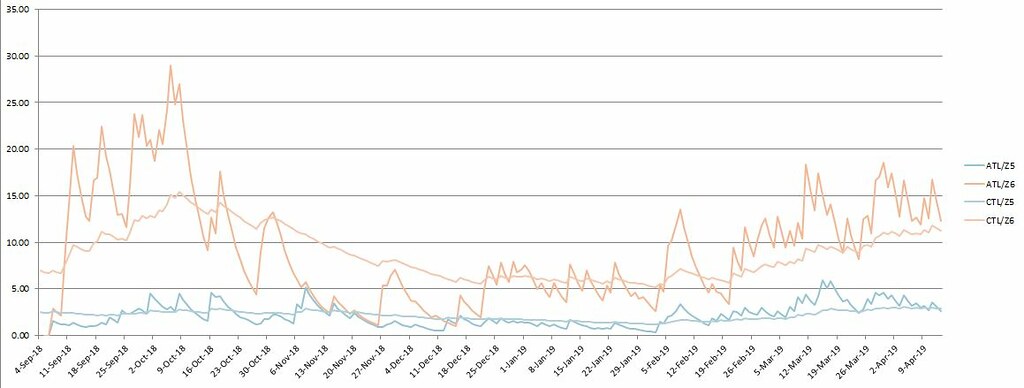
So, step 1 was to update the Excel sheet to give me TSS, CTL, ATL, TSB…….by zone. Then graph it.
Step 2, not complete, is to dump in some power/duration data into the same sheet
I had to play with stuff in the sheet to get the contributions of each to overall to make sense. However, I’ve gotten it pretty close so that when I’m in a SS workout time period before a gravel grinder…..you see Z2/Z3/Z4 TSB go negative and those loads go up. Same for now, doing VO2 stuff.
Just a little fun. It’ll take some time to dump the power/duration data into the sheet and get some plots for those milestones over time. That’ll take some farting around to get something meaningful to me.
If you have any suggestions of ways to display this or use it now that I’ve done it, I’m open to ideas.
So……data by zone……don't giggle at the numbers, remember it's by zone


I never really paid a lot of attention to it other than to see my values change when I would prepare for an event. Like, lots of TSS and Z2 and SS work before a gravel grinder. Then switch over to threshold/VO2 for road stuff, etc..
I know other stuff can probably do this, but I was curious as to how good or bad I was at choosing and executing some work in the right areas.
So, step 1 was to update the Excel sheet to give me TSS, CTL, ATL, TSB…….by zone. Then graph it.
Step 2, not complete, is to dump in some power/duration data into the same sheet
I had to play with stuff in the sheet to get the contributions of each to overall to make sense. However, I’ve gotten it pretty close so that when I’m in a SS workout time period before a gravel grinder…..you see Z2/Z3/Z4 TSB go negative and those loads go up. Same for now, doing VO2 stuff.
Just a little fun. It’ll take some time to dump the power/duration data into the sheet and get some plots for those milestones over time. That’ll take some farting around to get something meaningful to me.
If you have any suggestions of ways to display this or use it now that I’ve done it, I’m open to ideas.
So……data by zone……don't giggle at the numbers, remember it's by zone


